Afghan vs Immigrants from Bolivia Associate's Degree
COMPARE
Afghan
Immigrants from Bolivia
Associate's Degree
Associate's Degree Comparison
Afghans
Immigrants from Bolivia
48.9%
ASSOCIATE'S DEGREE
94.8/ 100
METRIC RATING
117th/ 347
METRIC RANK
51.5%
ASSOCIATE'S DEGREE
99.7/ 100
METRIC RATING
60th/ 347
METRIC RANK
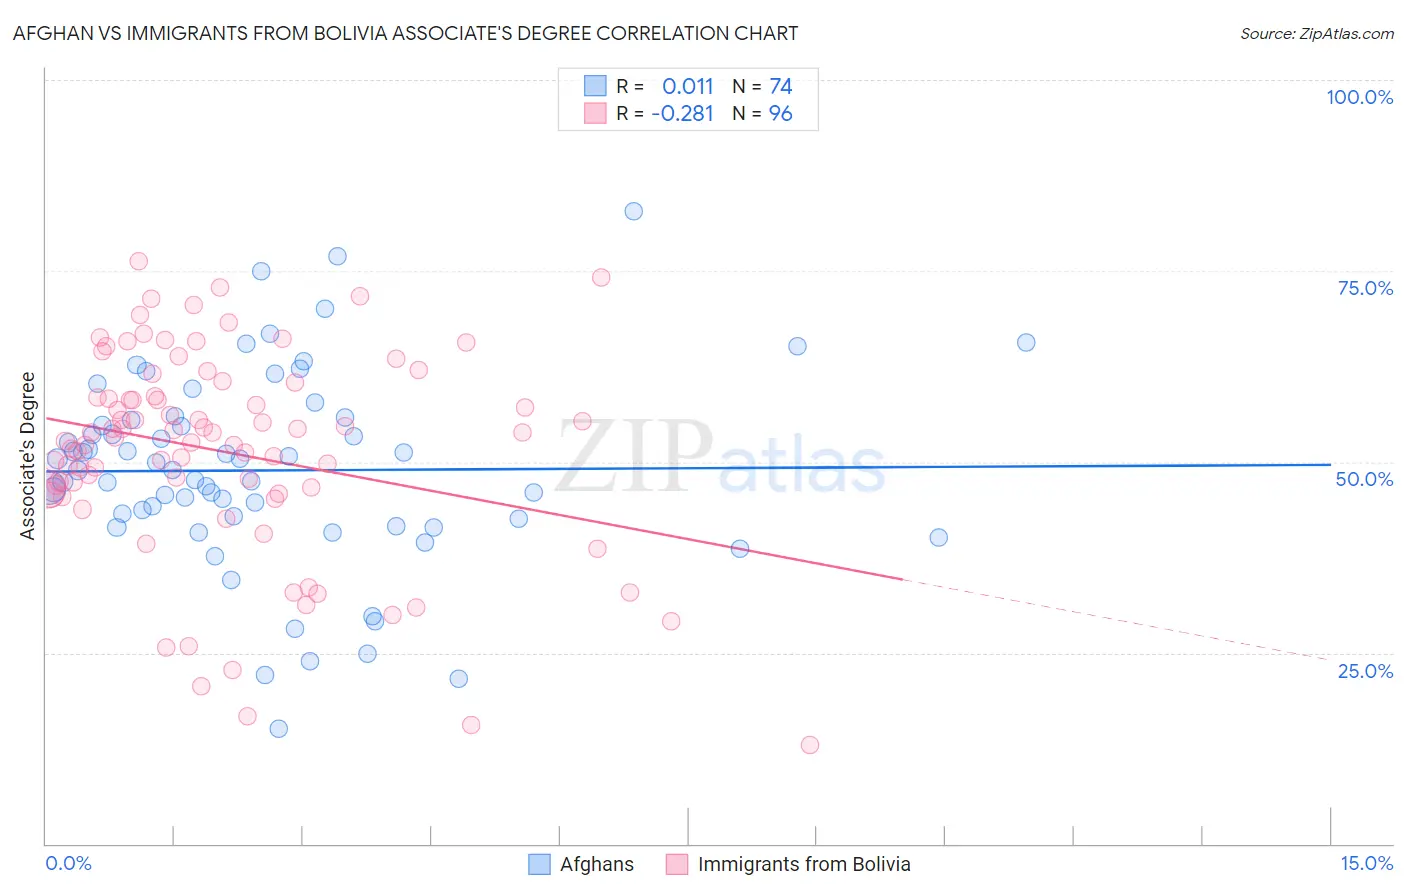
Afghan vs Immigrants from Bolivia Associate's Degree Correlation Chart
The statistical analysis conducted on geographies consisting of 148,873,892 people shows no correlation between the proportion of Afghans and percentage of population with at least associate's degree education in the United States with a correlation coefficient (R) of 0.011 and weighted average of 48.9%. Similarly, the statistical analysis conducted on geographies consisting of 158,730,512 people shows a weak negative correlation between the proportion of Immigrants from Bolivia and percentage of population with at least associate's degree education in the United States with a correlation coefficient (R) of -0.281 and weighted average of 51.5%, a difference of 5.4%.
Associate's Degree Correlation Summary
| Measurement | Afghan | Immigrants from Bolivia |
| Minimum | 15.1% | 12.9% |
| Maximum | 82.8% | 76.3% |
| Range | 67.7% | 63.4% |
| Mean | 48.9% | 51.2% |
| Median | 48.9% | 53.5% |
| Interquartile 25% (IQ1) | 42.6% | 46.1% |
| Interquartile 75% (IQ3) | 55.5% | 59.5% |
| Interquartile Range (IQR) | 12.9% | 13.4% |
| Standard Deviation (Sample) | 12.8% | 13.6% |
| Standard Deviation (Population) | 12.7% | 13.6% |
Similar Demographics by Associate's Degree
Demographics Similar to Afghans by Associate's Degree
In terms of associate's degree, the demographic groups most similar to Afghans are British (48.9%, a difference of 0.040%), Albanian (48.8%, a difference of 0.060%), Lebanese (48.8%, a difference of 0.070%), Alsatian (48.8%, a difference of 0.10%), and Luxembourger (48.9%, a difference of 0.11%).
| Demographics | Rating | Rank | Associate's Degree |
| Austrians | 95.8 /100 | #110 | Exceptional 49.1% |
| Immigrants | Venezuela | 95.8 /100 | #111 | Exceptional 49.1% |
| Immigrants | Chile | 95.3 /100 | #112 | Exceptional 49.0% |
| Palestinians | 95.3 /100 | #113 | Exceptional 49.0% |
| Arabs | 95.3 /100 | #114 | Exceptional 49.0% |
| Luxembourgers | 95.1 /100 | #115 | Exceptional 48.9% |
| British | 95.0 /100 | #116 | Exceptional 48.9% |
| Afghans | 94.8 /100 | #117 | Exceptional 48.9% |
| Albanians | 94.7 /100 | #118 | Exceptional 48.8% |
| Lebanese | 94.6 /100 | #119 | Exceptional 48.8% |
| Alsatians | 94.6 /100 | #120 | Exceptional 48.8% |
| Ugandans | 93.9 /100 | #121 | Exceptional 48.7% |
| Italians | 93.9 /100 | #122 | Exceptional 48.7% |
| Brazilians | 93.7 /100 | #123 | Exceptional 48.7% |
| Serbians | 92.6 /100 | #124 | Exceptional 48.5% |
Demographics Similar to Immigrants from Bolivia by Associate's Degree
In terms of associate's degree, the demographic groups most similar to Immigrants from Bolivia are Immigrants from Kazakhstan (51.4%, a difference of 0.15%), Bhutanese (51.4%, a difference of 0.15%), South African (51.4%, a difference of 0.21%), Immigrants from Netherlands (51.4%, a difference of 0.28%), and Zimbabwean (51.3%, a difference of 0.31%).
| Demographics | Rating | Rank | Associate's Degree |
| Immigrants | Asia | 99.8 /100 | #53 | Exceptional 52.0% |
| Immigrants | Spain | 99.8 /100 | #54 | Exceptional 51.9% |
| Australians | 99.8 /100 | #55 | Exceptional 51.9% |
| Immigrants | Czechoslovakia | 99.8 /100 | #56 | Exceptional 51.9% |
| Paraguayans | 99.8 /100 | #57 | Exceptional 51.8% |
| New Zealanders | 99.8 /100 | #58 | Exceptional 51.8% |
| Immigrants | Serbia | 99.8 /100 | #59 | Exceptional 51.7% |
| Immigrants | Bolivia | 99.7 /100 | #60 | Exceptional 51.5% |
| Immigrants | Kazakhstan | 99.7 /100 | #61 | Exceptional 51.4% |
| Bhutanese | 99.7 /100 | #62 | Exceptional 51.4% |
| South Africans | 99.7 /100 | #63 | Exceptional 51.4% |
| Immigrants | Netherlands | 99.7 /100 | #64 | Exceptional 51.4% |
| Zimbabweans | 99.7 /100 | #65 | Exceptional 51.3% |
| Immigrants | Europe | 99.7 /100 | #66 | Exceptional 51.3% |
| Argentineans | 99.6 /100 | #67 | Exceptional 51.2% |