Osage vs Immigrants from Europe 2nd Grade
COMPARE
Osage
Immigrants from Europe
2nd Grade
2nd Grade Comparison
Osage
Immigrants from Europe
98.2%
2ND GRADE
99.2/ 100
METRIC RATING
80th/ 347
METRIC RANK
98.0%
2ND GRADE
91.1/ 100
METRIC RATING
131st/ 347
METRIC RANK
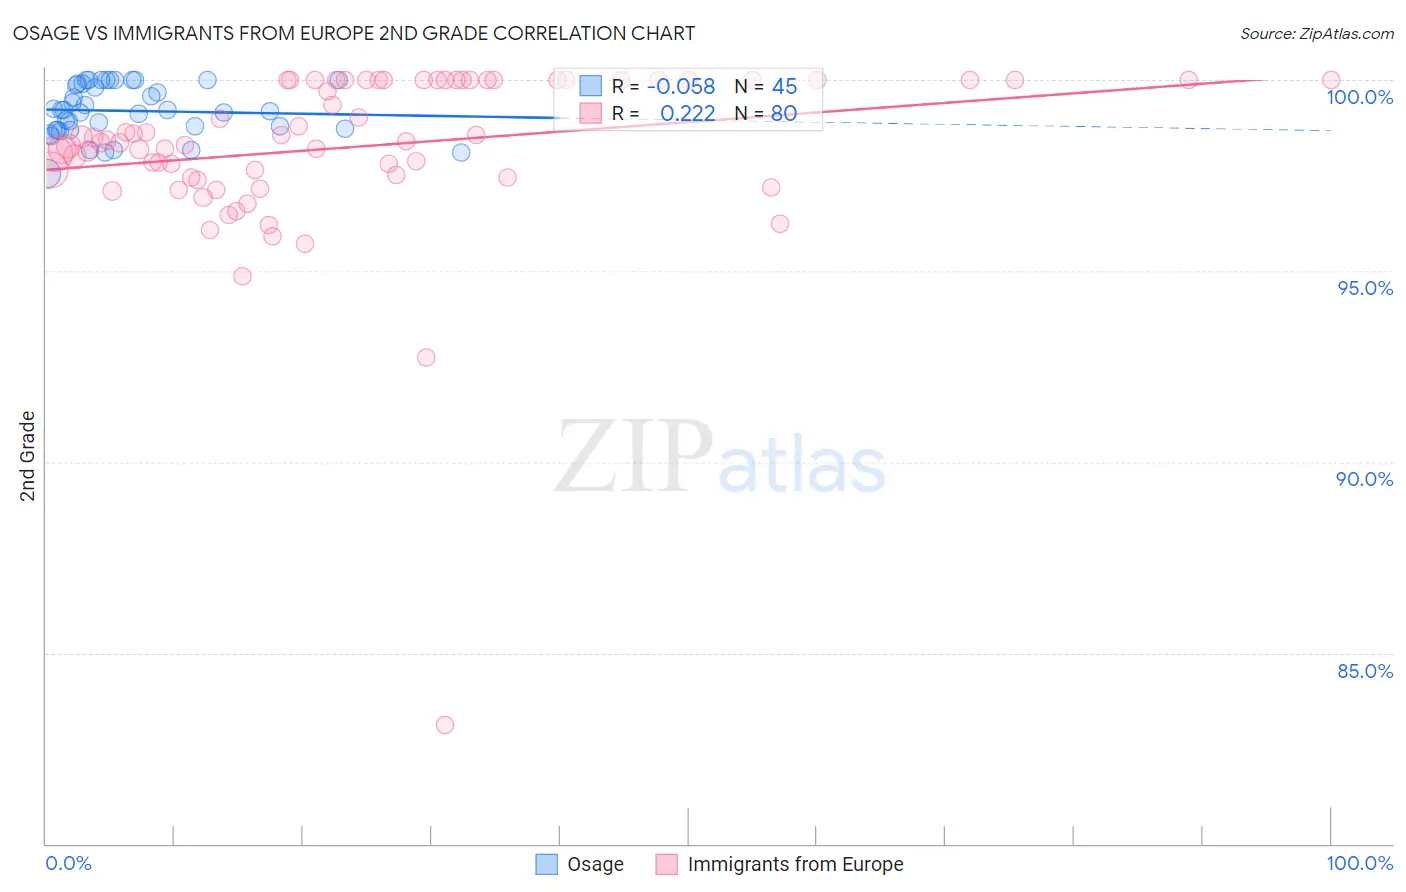
Osage vs Immigrants from Europe 2nd Grade Correlation Chart
The statistical analysis conducted on geographies consisting of 91,808,929 people shows a slight negative correlation between the proportion of Osage and percentage of population with at least 2nd grade education in the United States with a correlation coefficient (R) of -0.058 and weighted average of 98.2%. Similarly, the statistical analysis conducted on geographies consisting of 547,425,973 people shows a weak positive correlation between the proportion of Immigrants from Europe and percentage of population with at least 2nd grade education in the United States with a correlation coefficient (R) of 0.222 and weighted average of 98.0%, a difference of 0.20%.
2nd Grade Correlation Summary
| Measurement | Osage | Immigrants from Europe |
| Minimum | 97.5% | 83.1% |
| Maximum | 100.0% | 100.0% |
| Range | 2.5% | 16.9% |
| Mean | 99.2% | 98.3% |
| Median | 99.2% | 98.4% |
| Interquartile 25% (IQ1) | 98.7% | 97.5% |
| Interquartile 75% (IQ3) | 99.9% | 100.0% |
| Interquartile Range (IQR) | 1.2% | 2.5% |
| Standard Deviation (Sample) | 0.67% | 2.3% |
| Standard Deviation (Population) | 0.66% | 2.3% |
Similar Demographics by 2nd Grade
Demographics Similar to Osage by 2nd Grade
In terms of 2nd grade, the demographic groups most similar to Osage are Immigrants from Lithuania (98.2%, a difference of 0.0%), Immigrants from Belgium (98.2%, a difference of 0.0%), Shoshone (98.3%, a difference of 0.010%), Cherokee (98.3%, a difference of 0.010%), and Immigrants from England (98.3%, a difference of 0.010%).
| Demographics | Rating | Rank | 2nd Grade |
| Cajuns | 99.5 /100 | #73 | Exceptional 98.3% |
| Immigrants | Netherlands | 99.4 /100 | #74 | Exceptional 98.3% |
| Shoshone | 99.4 /100 | #75 | Exceptional 98.3% |
| Cherokee | 99.4 /100 | #76 | Exceptional 98.3% |
| Immigrants | England | 99.4 /100 | #77 | Exceptional 98.3% |
| Immigrants | Lithuania | 99.3 /100 | #78 | Exceptional 98.2% |
| Immigrants | Belgium | 99.3 /100 | #79 | Exceptional 98.2% |
| Osage | 99.2 /100 | #80 | Exceptional 98.2% |
| Icelanders | 99.2 /100 | #81 | Exceptional 98.2% |
| Delaware | 99.1 /100 | #82 | Exceptional 98.2% |
| Immigrants | Sweden | 99.1 /100 | #83 | Exceptional 98.2% |
| Hopi | 99.1 /100 | #84 | Exceptional 98.2% |
| Potawatomi | 99.1 /100 | #85 | Exceptional 98.2% |
| Immigrants | Australia | 99.0 /100 | #86 | Exceptional 98.2% |
| Immigrants | Denmark | 99.0 /100 | #87 | Exceptional 98.2% |
Demographics Similar to Immigrants from Europe by 2nd Grade
In terms of 2nd grade, the demographic groups most similar to Immigrants from Europe are Seminole (98.0%, a difference of 0.0%), Spaniard (98.0%, a difference of 0.0%), Cambodian (98.0%, a difference of 0.0%), Immigrants from Serbia (98.1%, a difference of 0.010%), and Immigrants from Croatia (98.1%, a difference of 0.010%).
| Demographics | Rating | Rank | 2nd Grade |
| Menominee | 94.1 /100 | #124 | Exceptional 98.1% |
| Iroquois | 94.1 /100 | #125 | Exceptional 98.1% |
| Syrians | 94.0 /100 | #126 | Exceptional 98.1% |
| Immigrants | Saudi Arabia | 93.6 /100 | #127 | Exceptional 98.1% |
| Immigrants | Serbia | 92.3 /100 | #128 | Exceptional 98.1% |
| Immigrants | Croatia | 92.1 /100 | #129 | Exceptional 98.1% |
| Seminole | 91.1 /100 | #130 | Exceptional 98.0% |
| Immigrants | Europe | 91.1 /100 | #131 | Exceptional 98.0% |
| Spaniards | 90.7 /100 | #132 | Exceptional 98.0% |
| Cambodians | 90.7 /100 | #133 | Exceptional 98.0% |
| Immigrants | Hungary | 89.7 /100 | #134 | Excellent 98.0% |
| Immigrants | Bulgaria | 89.7 /100 | #135 | Excellent 98.0% |
| Immigrants | Kuwait | 89.2 /100 | #136 | Excellent 98.0% |
| Immigrants | Romania | 88.3 /100 | #137 | Excellent 98.0% |
| Israelis | 87.9 /100 | #138 | Excellent 98.0% |