Osage vs Ethiopian Bachelor's Degree
COMPARE
Osage
Ethiopian
Bachelor's Degree
Bachelor's Degree Comparison
Osage
Ethiopians
33.0%
BACHELOR'S DEGREE
0.5/ 100
METRIC RATING
259th/ 347
METRIC RANK
42.8%
BACHELOR'S DEGREE
99.5/ 100
METRIC RATING
72nd/ 347
METRIC RANK
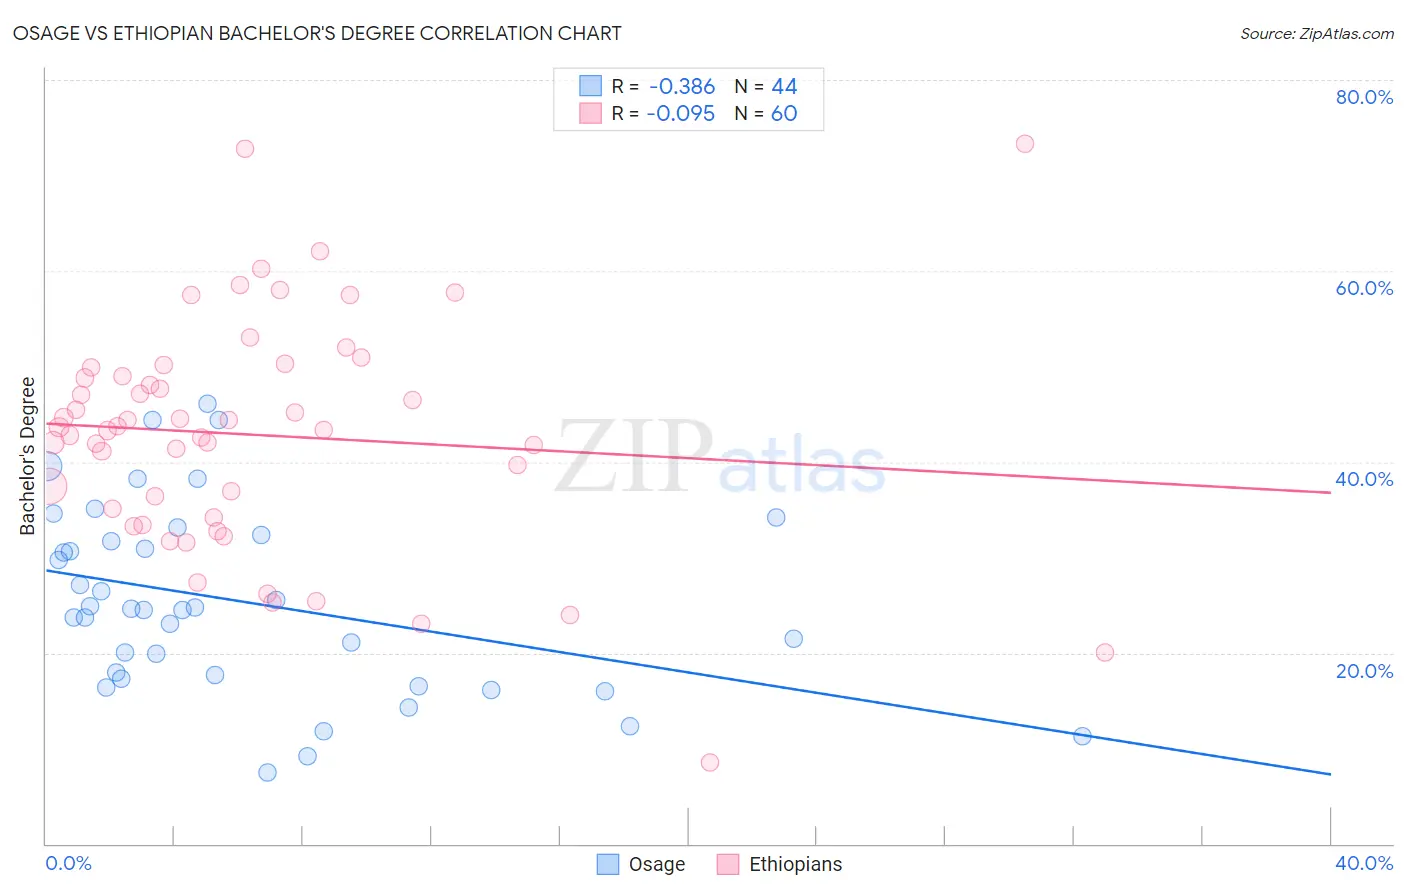
Osage vs Ethiopian Bachelor's Degree Correlation Chart
The statistical analysis conducted on geographies consisting of 91,806,618 people shows a mild negative correlation between the proportion of Osage and percentage of population with at least bachelor's degree education in the United States with a correlation coefficient (R) of -0.386 and weighted average of 33.0%. Similarly, the statistical analysis conducted on geographies consisting of 223,255,026 people shows a slight negative correlation between the proportion of Ethiopians and percentage of population with at least bachelor's degree education in the United States with a correlation coefficient (R) of -0.095 and weighted average of 42.8%, a difference of 29.5%.
Bachelor's Degree Correlation Summary
| Measurement | Osage | Ethiopian |
| Minimum | 7.5% | 8.5% |
| Maximum | 46.2% | 73.3% |
| Range | 38.7% | 64.9% |
| Mean | 25.3% | 42.8% |
| Median | 24.5% | 43.5% |
| Interquartile 25% (IQ1) | 17.5% | 34.6% |
| Interquartile 75% (IQ3) | 32.0% | 49.4% |
| Interquartile Range (IQR) | 14.6% | 14.8% |
| Standard Deviation (Sample) | 9.7% | 12.2% |
| Standard Deviation (Population) | 9.6% | 12.1% |
Similar Demographics by Bachelor's Degree
Demographics Similar to Osage by Bachelor's Degree
In terms of bachelor's degree, the demographic groups most similar to Osage are French American Indian (33.1%, a difference of 0.050%), Spanish American (33.1%, a difference of 0.090%), Nicaraguan (33.1%, a difference of 0.31%), Malaysian (32.9%, a difference of 0.36%), and African (32.9%, a difference of 0.45%).
| Demographics | Rating | Rank | Bachelor's Degree |
| Immigrants | Bahamas | 0.7 /100 | #252 | Tragic 33.3% |
| U.S. Virgin Islanders | 0.7 /100 | #253 | Tragic 33.2% |
| Native Hawaiians | 0.7 /100 | #254 | Tragic 33.2% |
| Iroquois | 0.7 /100 | #255 | Tragic 33.2% |
| Nicaraguans | 0.6 /100 | #256 | Tragic 33.1% |
| Spanish Americans | 0.6 /100 | #257 | Tragic 33.1% |
| French American Indians | 0.6 /100 | #258 | Tragic 33.1% |
| Osage | 0.5 /100 | #259 | Tragic 33.0% |
| Malaysians | 0.5 /100 | #260 | Tragic 32.9% |
| Africans | 0.5 /100 | #261 | Tragic 32.9% |
| Immigrants | Jamaica | 0.5 /100 | #262 | Tragic 32.9% |
| Belizeans | 0.4 /100 | #263 | Tragic 32.8% |
| Central American Indians | 0.3 /100 | #264 | Tragic 32.5% |
| Bahamians | 0.3 /100 | #265 | Tragic 32.5% |
| Immigrants | Dominica | 0.3 /100 | #266 | Tragic 32.5% |
Demographics Similar to Ethiopians by Bachelor's Degree
In terms of bachelor's degree, the demographic groups most similar to Ethiopians are Immigrants from Uzbekistan (42.8%, a difference of 0.050%), Immigrants from Argentina (42.8%, a difference of 0.090%), Bhutanese (42.7%, a difference of 0.27%), Immigrants from Romania (42.9%, a difference of 0.35%), and Immigrants from Zimbabwe (42.6%, a difference of 0.48%).
| Demographics | Rating | Rank | Bachelor's Degree |
| Zimbabweans | 99.7 /100 | #65 | Exceptional 43.3% |
| Immigrants | Netherlands | 99.7 /100 | #66 | Exceptional 43.3% |
| Egyptians | 99.7 /100 | #67 | Exceptional 43.3% |
| Immigrants | Indonesia | 99.7 /100 | #68 | Exceptional 43.3% |
| Immigrants | Pakistan | 99.7 /100 | #69 | Exceptional 43.1% |
| Immigrants | Romania | 99.6 /100 | #70 | Exceptional 42.9% |
| Immigrants | Argentina | 99.6 /100 | #71 | Exceptional 42.8% |
| Ethiopians | 99.5 /100 | #72 | Exceptional 42.8% |
| Immigrants | Uzbekistan | 99.5 /100 | #73 | Exceptional 42.8% |
| Bhutanese | 99.5 /100 | #74 | Exceptional 42.7% |
| Immigrants | Zimbabwe | 99.4 /100 | #75 | Exceptional 42.6% |
| Immigrants | Egypt | 99.4 /100 | #76 | Exceptional 42.6% |
| Immigrants | Eastern Europe | 99.4 /100 | #77 | Exceptional 42.5% |
| Immigrants | Ethiopia | 99.4 /100 | #78 | Exceptional 42.5% |
| Immigrants | Lebanon | 99.3 /100 | #79 | Exceptional 42.4% |