Osage vs Immigrants from Armenia Bachelor's Degree
COMPARE
Osage
Immigrants from Armenia
Bachelor's Degree
Bachelor's Degree Comparison
Osage
Immigrants from Armenia
33.0%
BACHELOR'S DEGREE
0.5/ 100
METRIC RATING
259th/ 347
METRIC RANK
39.4%
BACHELOR'S DEGREE
84.1/ 100
METRIC RATING
140th/ 347
METRIC RANK
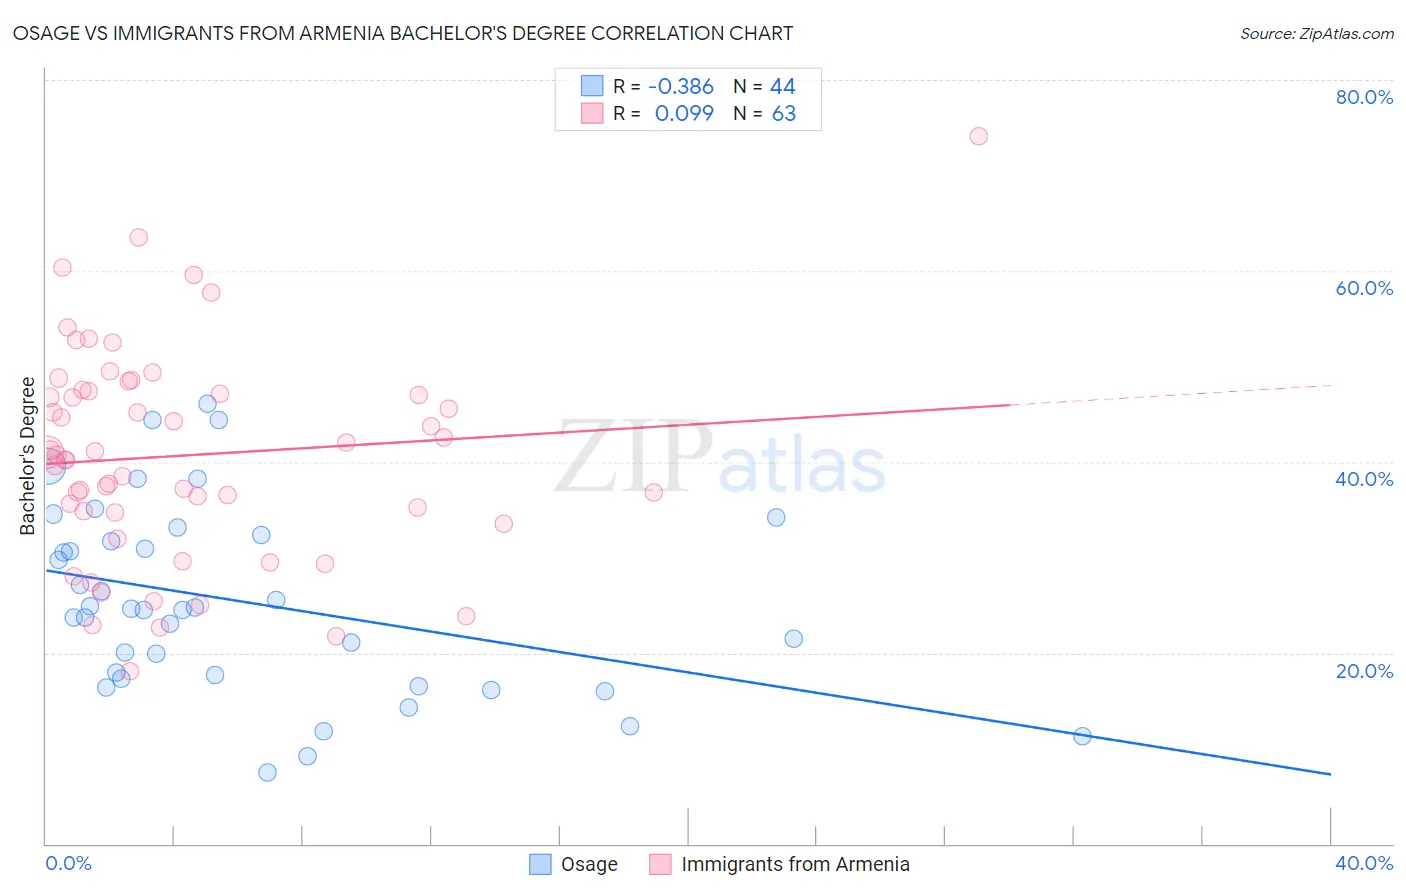
Osage vs Immigrants from Armenia Bachelor's Degree Correlation Chart
The statistical analysis conducted on geographies consisting of 91,806,618 people shows a mild negative correlation between the proportion of Osage and percentage of population with at least bachelor's degree education in the United States with a correlation coefficient (R) of -0.386 and weighted average of 33.0%. Similarly, the statistical analysis conducted on geographies consisting of 97,721,630 people shows a slight positive correlation between the proportion of Immigrants from Armenia and percentage of population with at least bachelor's degree education in the United States with a correlation coefficient (R) of 0.099 and weighted average of 39.4%, a difference of 19.1%.
Bachelor's Degree Correlation Summary
| Measurement | Osage | Immigrants from Armenia |
| Minimum | 7.5% | 18.0% |
| Maximum | 46.2% | 74.1% |
| Range | 38.7% | 56.1% |
| Mean | 25.3% | 40.7% |
| Median | 24.5% | 40.7% |
| Interquartile 25% (IQ1) | 17.5% | 34.7% |
| Interquartile 75% (IQ3) | 32.0% | 47.3% |
| Interquartile Range (IQR) | 14.6% | 12.6% |
| Standard Deviation (Sample) | 9.7% | 11.0% |
| Standard Deviation (Population) | 9.6% | 10.9% |
Similar Demographics by Bachelor's Degree
Demographics Similar to Osage by Bachelor's Degree
In terms of bachelor's degree, the demographic groups most similar to Osage are French American Indian (33.1%, a difference of 0.050%), Spanish American (33.1%, a difference of 0.090%), Nicaraguan (33.1%, a difference of 0.31%), Malaysian (32.9%, a difference of 0.36%), and African (32.9%, a difference of 0.45%).
| Demographics | Rating | Rank | Bachelor's Degree |
| Immigrants | Bahamas | 0.7 /100 | #252 | Tragic 33.3% |
| U.S. Virgin Islanders | 0.7 /100 | #253 | Tragic 33.2% |
| Native Hawaiians | 0.7 /100 | #254 | Tragic 33.2% |
| Iroquois | 0.7 /100 | #255 | Tragic 33.2% |
| Nicaraguans | 0.6 /100 | #256 | Tragic 33.1% |
| Spanish Americans | 0.6 /100 | #257 | Tragic 33.1% |
| French American Indians | 0.6 /100 | #258 | Tragic 33.1% |
| Osage | 0.5 /100 | #259 | Tragic 33.0% |
| Malaysians | 0.5 /100 | #260 | Tragic 32.9% |
| Africans | 0.5 /100 | #261 | Tragic 32.9% |
| Immigrants | Jamaica | 0.5 /100 | #262 | Tragic 32.9% |
| Belizeans | 0.4 /100 | #263 | Tragic 32.8% |
| Central American Indians | 0.3 /100 | #264 | Tragic 32.5% |
| Bahamians | 0.3 /100 | #265 | Tragic 32.5% |
| Immigrants | Dominica | 0.3 /100 | #266 | Tragic 32.5% |
Demographics Similar to Immigrants from Armenia by Bachelor's Degree
In terms of bachelor's degree, the demographic groups most similar to Immigrants from Armenia are Immigrants from Sudan (39.4%, a difference of 0.070%), South American Indian (39.3%, a difference of 0.090%), European (39.5%, a difference of 0.27%), Immigrants from North Macedonia (39.2%, a difference of 0.41%), and Icelander (39.5%, a difference of 0.44%).
| Demographics | Rating | Rank | Bachelor's Degree |
| Immigrants | Southern Europe | 91.1 /100 | #133 | Exceptional 40.0% |
| Assyrians/Chaldeans/Syriacs | 89.4 /100 | #134 | Excellent 39.8% |
| Luxembourgers | 89.1 /100 | #135 | Excellent 39.8% |
| Pakistanis | 88.2 /100 | #136 | Excellent 39.7% |
| Icelanders | 86.5 /100 | #137 | Excellent 39.5% |
| Europeans | 85.6 /100 | #138 | Excellent 39.5% |
| Immigrants | Sudan | 84.5 /100 | #139 | Excellent 39.4% |
| Immigrants | Armenia | 84.1 /100 | #140 | Excellent 39.4% |
| South American Indians | 83.6 /100 | #141 | Excellent 39.3% |
| Immigrants | North Macedonia | 81.6 /100 | #142 | Excellent 39.2% |
| Poles | 79.8 /100 | #143 | Good 39.1% |
| Immigrants | Afghanistan | 79.7 /100 | #144 | Good 39.1% |
| Slovenes | 79.5 /100 | #145 | Good 39.1% |
| Swedes | 79.2 /100 | #146 | Good 39.1% |
| Immigrants | Sierra Leone | 79.0 /100 | #147 | Good 39.0% |