Osage vs Immigrants from Taiwan Bachelor's Degree
COMPARE
Osage
Immigrants from Taiwan
Bachelor's Degree
Bachelor's Degree Comparison
Osage
Immigrants from Taiwan
33.0%
BACHELOR'S DEGREE
0.5/ 100
METRIC RATING
259th/ 347
METRIC RANK
51.2%
BACHELOR'S DEGREE
100.0/ 100
METRIC RATING
4th/ 347
METRIC RANK
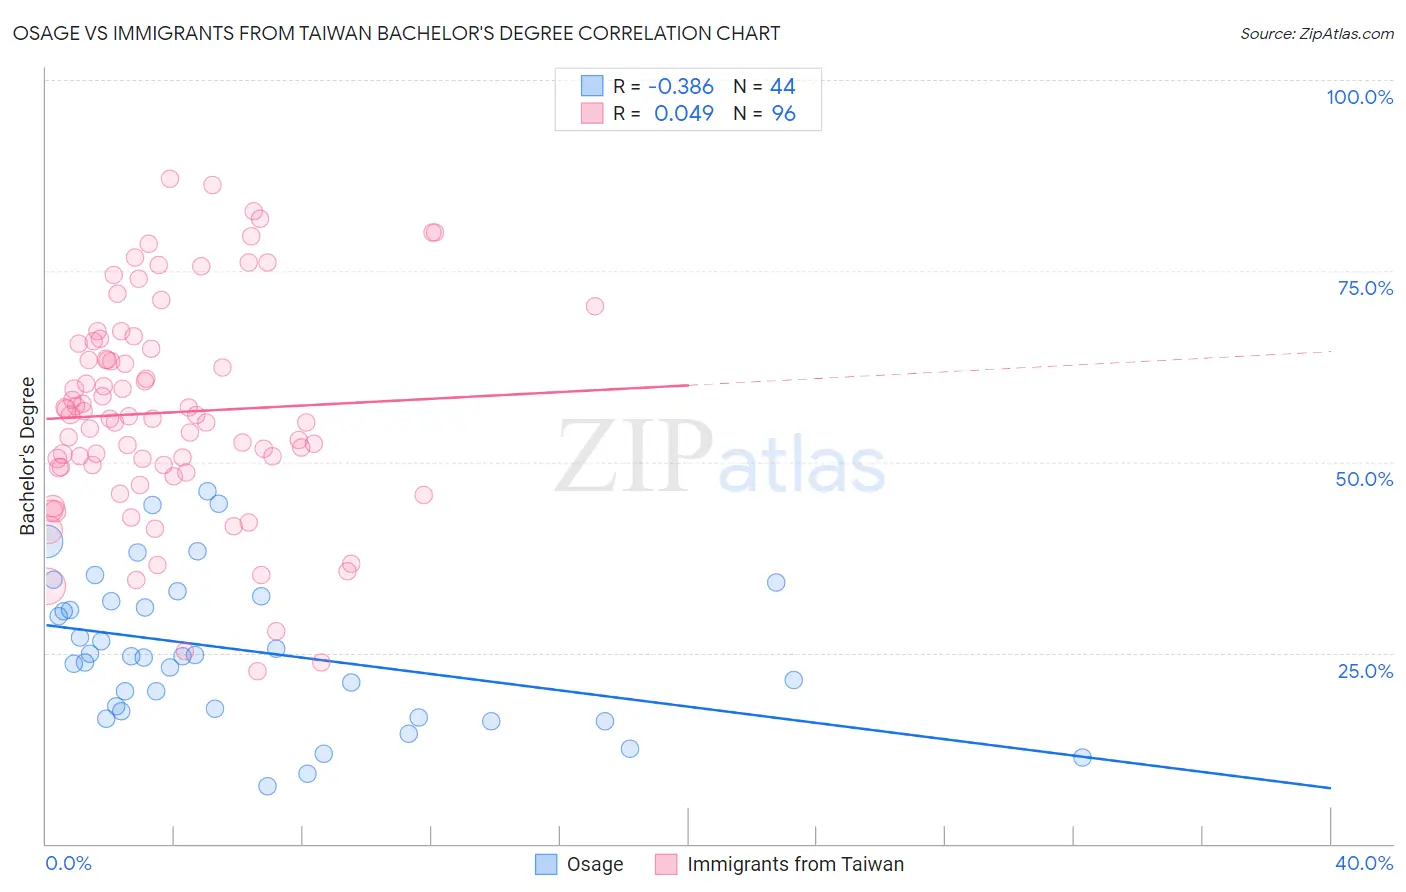
Osage vs Immigrants from Taiwan Bachelor's Degree Correlation Chart
The statistical analysis conducted on geographies consisting of 91,806,618 people shows a mild negative correlation between the proportion of Osage and percentage of population with at least bachelor's degree education in the United States with a correlation coefficient (R) of -0.386 and weighted average of 33.0%. Similarly, the statistical analysis conducted on geographies consisting of 298,272,482 people shows no correlation between the proportion of Immigrants from Taiwan and percentage of population with at least bachelor's degree education in the United States with a correlation coefficient (R) of 0.049 and weighted average of 51.2%, a difference of 54.9%.
Bachelor's Degree Correlation Summary
| Measurement | Osage | Immigrants from Taiwan |
| Minimum | 7.5% | 22.6% |
| Maximum | 46.2% | 87.1% |
| Range | 38.7% | 64.5% |
| Mean | 25.3% | 56.5% |
| Median | 24.5% | 55.9% |
| Interquartile 25% (IQ1) | 17.5% | 49.3% |
| Interquartile 75% (IQ3) | 32.0% | 65.1% |
| Interquartile Range (IQR) | 14.6% | 15.9% |
| Standard Deviation (Sample) | 9.7% | 14.1% |
| Standard Deviation (Population) | 9.6% | 14.0% |
Similar Demographics by Bachelor's Degree
Demographics Similar to Osage by Bachelor's Degree
In terms of bachelor's degree, the demographic groups most similar to Osage are French American Indian (33.1%, a difference of 0.050%), Spanish American (33.1%, a difference of 0.090%), Nicaraguan (33.1%, a difference of 0.31%), Malaysian (32.9%, a difference of 0.36%), and African (32.9%, a difference of 0.45%).
| Demographics | Rating | Rank | Bachelor's Degree |
| Immigrants | Bahamas | 0.7 /100 | #252 | Tragic 33.3% |
| U.S. Virgin Islanders | 0.7 /100 | #253 | Tragic 33.2% |
| Native Hawaiians | 0.7 /100 | #254 | Tragic 33.2% |
| Iroquois | 0.7 /100 | #255 | Tragic 33.2% |
| Nicaraguans | 0.6 /100 | #256 | Tragic 33.1% |
| Spanish Americans | 0.6 /100 | #257 | Tragic 33.1% |
| French American Indians | 0.6 /100 | #258 | Tragic 33.1% |
| Osage | 0.5 /100 | #259 | Tragic 33.0% |
| Malaysians | 0.5 /100 | #260 | Tragic 32.9% |
| Africans | 0.5 /100 | #261 | Tragic 32.9% |
| Immigrants | Jamaica | 0.5 /100 | #262 | Tragic 32.9% |
| Belizeans | 0.4 /100 | #263 | Tragic 32.8% |
| Central American Indians | 0.3 /100 | #264 | Tragic 32.5% |
| Bahamians | 0.3 /100 | #265 | Tragic 32.5% |
| Immigrants | Dominica | 0.3 /100 | #266 | Tragic 32.5% |
Demographics Similar to Immigrants from Taiwan by Bachelor's Degree
In terms of bachelor's degree, the demographic groups most similar to Immigrants from Taiwan are Immigrants from India (51.3%, a difference of 0.21%), Iranian (51.0%, a difference of 0.42%), Okinawan (50.5%, a difference of 1.3%), Immigrants from Singapore (51.9%, a difference of 1.4%), and Immigrants from Iran (50.3%, a difference of 1.7%).
| Demographics | Rating | Rank | Bachelor's Degree |
| Filipinos | 100.0 /100 | #1 | Exceptional 52.7% |
| Immigrants | Singapore | 100.0 /100 | #2 | Exceptional 51.9% |
| Immigrants | India | 100.0 /100 | #3 | Exceptional 51.3% |
| Immigrants | Taiwan | 100.0 /100 | #4 | Exceptional 51.2% |
| Iranians | 100.0 /100 | #5 | Exceptional 51.0% |
| Okinawans | 100.0 /100 | #6 | Exceptional 50.5% |
| Immigrants | Iran | 100.0 /100 | #7 | Exceptional 50.3% |
| Thais | 100.0 /100 | #8 | Exceptional 50.1% |
| Immigrants | Israel | 100.0 /100 | #9 | Exceptional 50.0% |
| Cypriots | 100.0 /100 | #10 | Exceptional 49.0% |
| Immigrants | Australia | 100.0 /100 | #11 | Exceptional 48.5% |
| Immigrants | China | 100.0 /100 | #12 | Exceptional 48.4% |
| Immigrants | South Central Asia | 100.0 /100 | #13 | Exceptional 48.3% |
| Immigrants | Hong Kong | 100.0 /100 | #14 | Exceptional 48.2% |
| Immigrants | Eastern Asia | 100.0 /100 | #15 | Exceptional 48.1% |