Osage vs Marshallese Bachelor's Degree
COMPARE
Osage
Marshallese
Bachelor's Degree
Bachelor's Degree Comparison
Osage
Marshallese
33.0%
BACHELOR'S DEGREE
0.5/ 100
METRIC RATING
259th/ 347
METRIC RANK
31.7%
BACHELOR'S DEGREE
0.1/ 100
METRIC RATING
278th/ 347
METRIC RANK
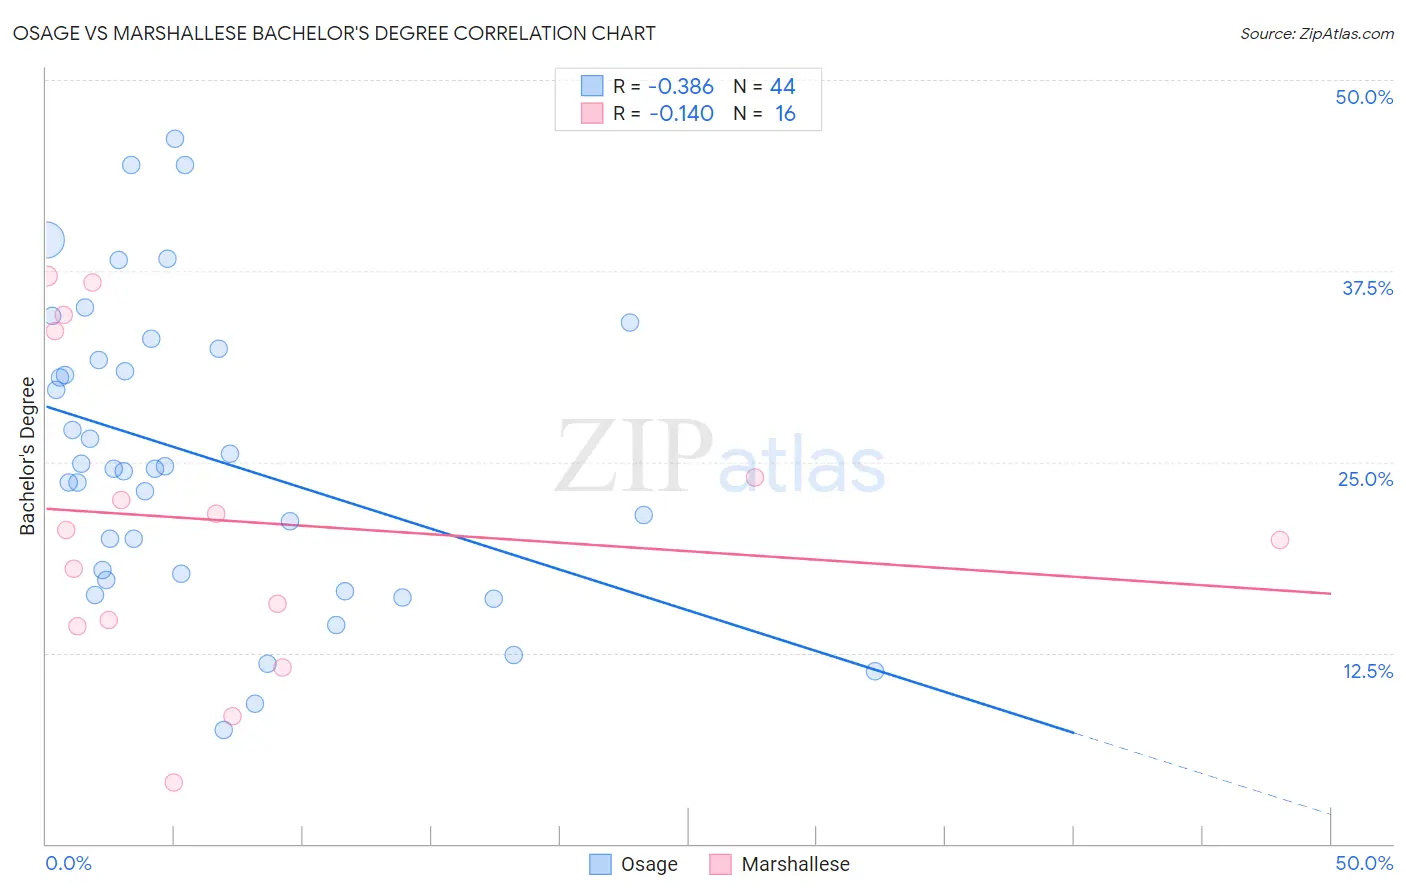
Osage vs Marshallese Bachelor's Degree Correlation Chart
The statistical analysis conducted on geographies consisting of 91,806,618 people shows a mild negative correlation between the proportion of Osage and percentage of population with at least bachelor's degree education in the United States with a correlation coefficient (R) of -0.386 and weighted average of 33.0%. Similarly, the statistical analysis conducted on geographies consisting of 14,761,315 people shows a poor negative correlation between the proportion of Marshallese and percentage of population with at least bachelor's degree education in the United States with a correlation coefficient (R) of -0.140 and weighted average of 31.7%, a difference of 4.1%.
Bachelor's Degree Correlation Summary
| Measurement | Osage | Marshallese |
| Minimum | 7.5% | 4.0% |
| Maximum | 46.2% | 37.2% |
| Range | 38.7% | 33.1% |
| Mean | 25.3% | 21.1% |
| Median | 24.5% | 20.2% |
| Interquartile 25% (IQ1) | 17.5% | 14.4% |
| Interquartile 75% (IQ3) | 32.0% | 28.8% |
| Interquartile Range (IQR) | 14.6% | 14.3% |
| Standard Deviation (Sample) | 9.7% | 10.1% |
| Standard Deviation (Population) | 9.6% | 9.8% |
Demographics Similar to Osage and Marshallese by Bachelor's Degree
In terms of bachelor's degree, the demographic groups most similar to Osage are French American Indian (33.1%, a difference of 0.050%), Malaysian (32.9%, a difference of 0.36%), African (32.9%, a difference of 0.45%), Immigrants from Jamaica (32.9%, a difference of 0.45%), and Belizean (32.8%, a difference of 0.75%). Similarly, the demographic groups most similar to Marshallese are Dominican (31.8%, a difference of 0.050%), Salvadoran (31.8%, a difference of 0.20%), Samoan (31.8%, a difference of 0.24%), Potawatomi (31.9%, a difference of 0.37%), and American (31.9%, a difference of 0.39%).
| Demographics | Rating | Rank | Bachelor's Degree |
| French American Indians | 0.6 /100 | #258 | Tragic 33.1% |
| Osage | 0.5 /100 | #259 | Tragic 33.0% |
| Malaysians | 0.5 /100 | #260 | Tragic 32.9% |
| Africans | 0.5 /100 | #261 | Tragic 32.9% |
| Immigrants | Jamaica | 0.5 /100 | #262 | Tragic 32.9% |
| Belizeans | 0.4 /100 | #263 | Tragic 32.8% |
| Central American Indians | 0.3 /100 | #264 | Tragic 32.5% |
| Bahamians | 0.3 /100 | #265 | Tragic 32.5% |
| Immigrants | Dominica | 0.3 /100 | #266 | Tragic 32.5% |
| Cubans | 0.3 /100 | #267 | Tragic 32.5% |
| Immigrants | Portugal | 0.2 /100 | #268 | Tragic 32.2% |
| Immigrants | Belize | 0.2 /100 | #269 | Tragic 32.1% |
| Immigrants | Nicaragua | 0.2 /100 | #270 | Tragic 31.9% |
| Central Americans | 0.2 /100 | #271 | Tragic 31.9% |
| Comanche | 0.2 /100 | #272 | Tragic 31.9% |
| Americans | 0.2 /100 | #273 | Tragic 31.9% |
| Potawatomi | 0.2 /100 | #274 | Tragic 31.9% |
| Samoans | 0.1 /100 | #275 | Tragic 31.8% |
| Salvadorans | 0.1 /100 | #276 | Tragic 31.8% |
| Dominicans | 0.1 /100 | #277 | Tragic 31.8% |
| Marshallese | 0.1 /100 | #278 | Tragic 31.7% |