Bulgarian vs Bermudan 8th Grade
COMPARE
Bulgarian
Bermudan
8th Grade
8th Grade Comparison
Bulgarians
Bermudans
96.9%
8TH GRADE
99.9/ 100
METRIC RATING
47th/ 347
METRIC RANK
95.8%
8TH GRADE
67.5/ 100
METRIC RATING
161st/ 347
METRIC RANK
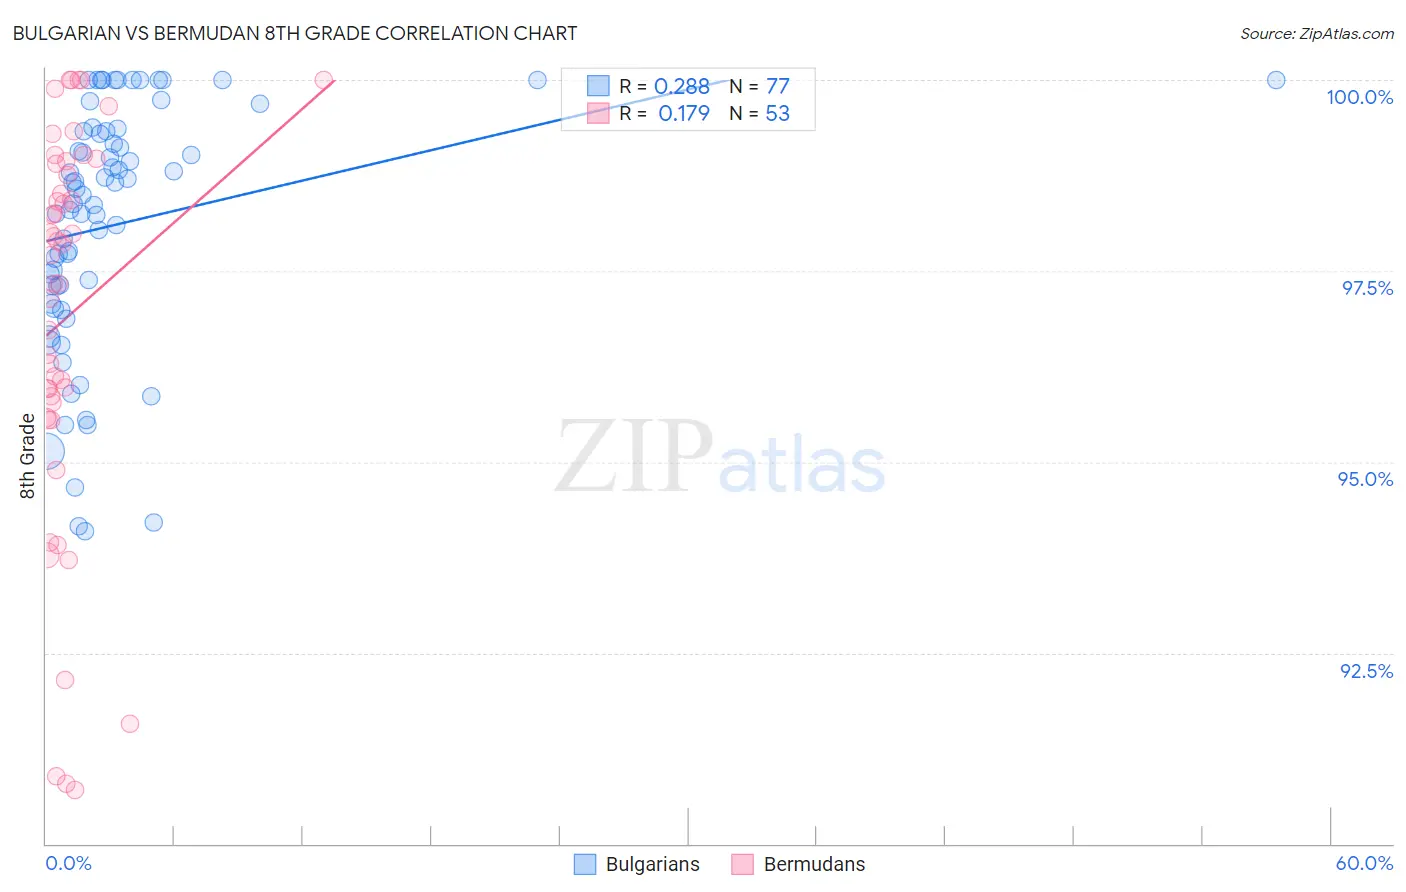
Bulgarian vs Bermudan 8th Grade Correlation Chart
The statistical analysis conducted on geographies consisting of 205,632,052 people shows a weak positive correlation between the proportion of Bulgarians and percentage of population with at least 8th grade education in the United States with a correlation coefficient (R) of 0.288 and weighted average of 96.9%. Similarly, the statistical analysis conducted on geographies consisting of 55,732,793 people shows a poor positive correlation between the proportion of Bermudans and percentage of population with at least 8th grade education in the United States with a correlation coefficient (R) of 0.179 and weighted average of 95.8%, a difference of 1.1%.
8th Grade Correlation Summary
| Measurement | Bulgarian | Bermudan |
| Minimum | 94.1% | 90.7% |
| Maximum | 100.0% | 100.0% |
| Range | 5.9% | 9.3% |
| Mean | 98.1% | 96.9% |
| Median | 98.5% | 97.7% |
| Interquartile 25% (IQ1) | 97.2% | 95.7% |
| Interquartile 75% (IQ3) | 99.3% | 98.9% |
| Interquartile Range (IQR) | 2.1% | 3.2% |
| Standard Deviation (Sample) | 1.6% | 2.5% |
| Standard Deviation (Population) | 1.6% | 2.5% |
Similar Demographics by 8th Grade
Demographics Similar to Bulgarians by 8th Grade
In terms of 8th grade, the demographic groups most similar to Bulgarians are Czechoslovakian (96.9%, a difference of 0.010%), Maltese (96.9%, a difference of 0.020%), Northern European (96.9%, a difference of 0.020%), Slavic (96.8%, a difference of 0.030%), and Aleut (96.9%, a difference of 0.040%).
| Demographics | Rating | Rank | 8th Grade |
| Inupiat | 100.0 /100 | #40 | Exceptional 97.0% |
| Eastern Europeans | 100.0 /100 | #41 | Exceptional 97.0% |
| Chinese | 100.0 /100 | #42 | Exceptional 96.9% |
| Aleuts | 99.9 /100 | #43 | Exceptional 96.9% |
| Maltese | 99.9 /100 | #44 | Exceptional 96.9% |
| Northern Europeans | 99.9 /100 | #45 | Exceptional 96.9% |
| Czechoslovakians | 99.9 /100 | #46 | Exceptional 96.9% |
| Bulgarians | 99.9 /100 | #47 | Exceptional 96.9% |
| Slavs | 99.9 /100 | #48 | Exceptional 96.8% |
| Estonians | 99.9 /100 | #49 | Exceptional 96.8% |
| Immigrants | Scotland | 99.9 /100 | #50 | Exceptional 96.8% |
| Celtics | 99.9 /100 | #51 | Exceptional 96.8% |
| Greeks | 99.9 /100 | #52 | Exceptional 96.8% |
| Austrians | 99.9 /100 | #53 | Exceptional 96.7% |
| Serbians | 99.8 /100 | #54 | Exceptional 96.7% |
Demographics Similar to Bermudans by 8th Grade
In terms of 8th grade, the demographic groups most similar to Bermudans are Seminole (95.8%, a difference of 0.0%), Immigrants from Kenya (95.8%, a difference of 0.0%), Arab (95.9%, a difference of 0.010%), Immigrants from Kazakhstan (95.9%, a difference of 0.010%), and Immigrants from Taiwan (95.9%, a difference of 0.020%).
| Demographics | Rating | Rank | 8th Grade |
| Hopi | 79.4 /100 | #154 | Good 95.9% |
| Kenyans | 74.5 /100 | #155 | Good 95.9% |
| Ugandans | 74.1 /100 | #156 | Good 95.9% |
| Immigrants | Taiwan | 70.5 /100 | #157 | Good 95.9% |
| Arabs | 69.4 /100 | #158 | Good 95.9% |
| Immigrants | Kazakhstan | 68.4 /100 | #159 | Good 95.9% |
| Seminole | 67.7 /100 | #160 | Good 95.8% |
| Bermudans | 67.5 /100 | #161 | Good 95.8% |
| Immigrants | Kenya | 67.2 /100 | #162 | Good 95.8% |
| Immigrants | Sri Lanka | 64.1 /100 | #163 | Good 95.8% |
| Immigrants | Italy | 63.5 /100 | #164 | Good 95.8% |
| Alsatians | 61.4 /100 | #165 | Good 95.8% |
| Immigrants | Poland | 61.1 /100 | #166 | Good 95.8% |
| Spaniards | 60.0 /100 | #167 | Good 95.8% |
| Immigrants | Ukraine | 59.5 /100 | #168 | Average 95.8% |