Okinawan vs Barbadian Associate's Degree
COMPARE
Okinawan
Barbadian
Associate's Degree
Associate's Degree Comparison
Okinawans
Barbadians
57.7%
ASSOCIATE'S DEGREE
100.0/ 100
METRIC RATING
6th/ 347
METRIC RANK
43.9%
ASSOCIATE'S DEGREE
5.8/ 100
METRIC RATING
222nd/ 347
METRIC RANK
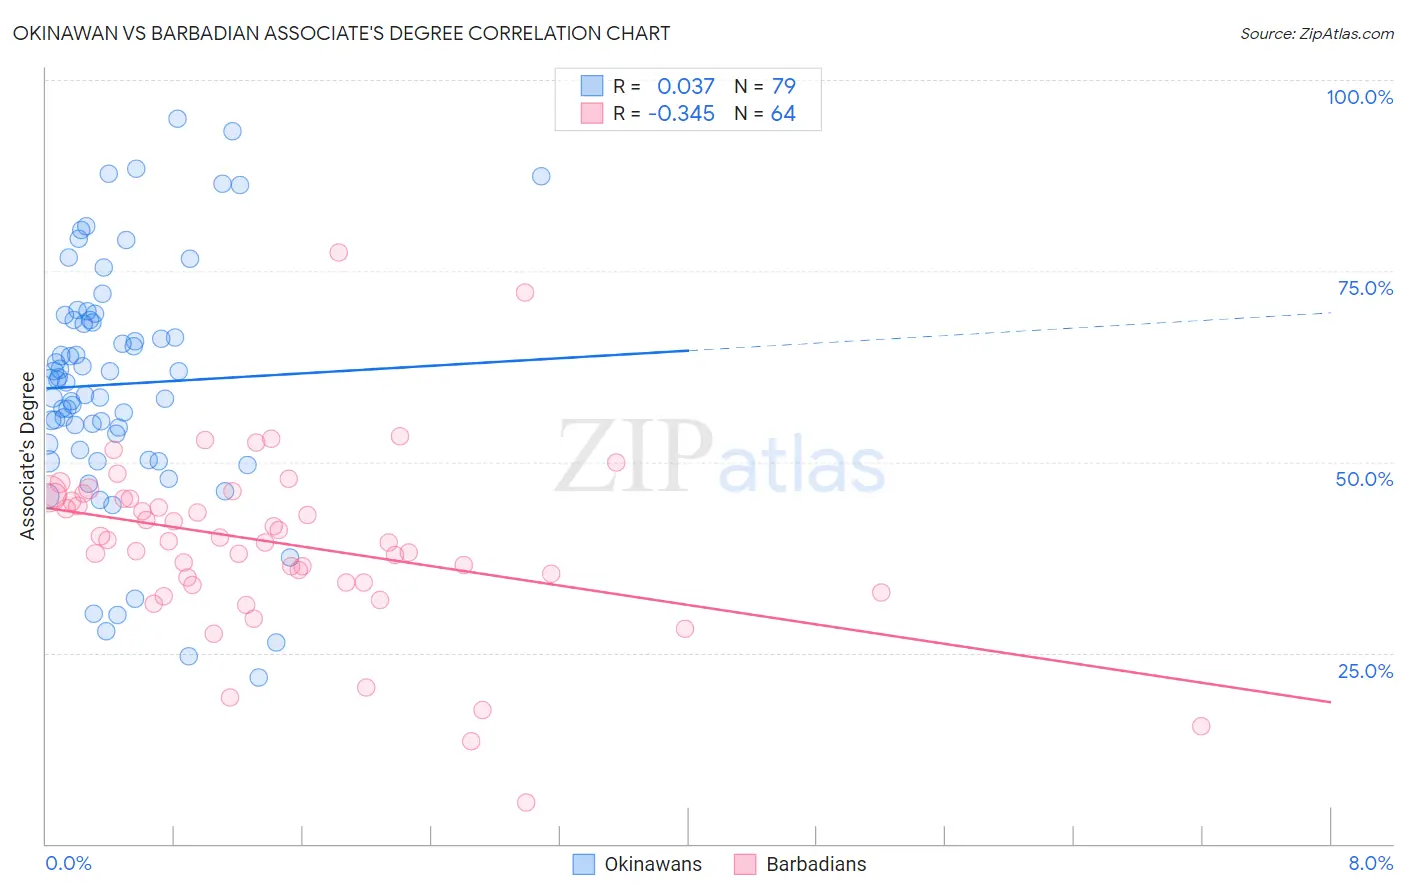
Okinawan vs Barbadian Associate's Degree Correlation Chart
The statistical analysis conducted on geographies consisting of 73,779,368 people shows no correlation between the proportion of Okinawans and percentage of population with at least associate's degree education in the United States with a correlation coefficient (R) of 0.037 and weighted average of 57.7%. Similarly, the statistical analysis conducted on geographies consisting of 141,300,746 people shows a mild negative correlation between the proportion of Barbadians and percentage of population with at least associate's degree education in the United States with a correlation coefficient (R) of -0.345 and weighted average of 43.9%, a difference of 31.3%.
Associate's Degree Correlation Summary
| Measurement | Okinawan | Barbadian |
| Minimum | 21.7% | 5.4% |
| Maximum | 95.0% | 77.4% |
| Range | 73.3% | 72.1% |
| Mean | 60.2% | 39.4% |
| Median | 60.7% | 39.7% |
| Interquartile 25% (IQ1) | 51.5% | 34.2% |
| Interquartile 75% (IQ3) | 68.7% | 45.4% |
| Interquartile Range (IQR) | 17.1% | 11.2% |
| Standard Deviation (Sample) | 15.8% | 11.7% |
| Standard Deviation (Population) | 15.7% | 11.6% |
Similar Demographics by Associate's Degree
Demographics Similar to Okinawans by Associate's Degree
In terms of associate's degree, the demographic groups most similar to Okinawans are Immigrants from Iran (57.7%, a difference of 0.060%), Thai (57.4%, a difference of 0.46%), Iranian (58.2%, a difference of 0.83%), Immigrants from Taiwan (58.4%, a difference of 1.2%), and Immigrants from India (58.5%, a difference of 1.5%).
| Demographics | Rating | Rank | Associate's Degree |
| Filipinos | 100.0 /100 | #1 | Exceptional 59.8% |
| Immigrants | Singapore | 100.0 /100 | #2 | Exceptional 58.9% |
| Immigrants | India | 100.0 /100 | #3 | Exceptional 58.5% |
| Immigrants | Taiwan | 100.0 /100 | #4 | Exceptional 58.4% |
| Iranians | 100.0 /100 | #5 | Exceptional 58.2% |
| Okinawans | 100.0 /100 | #6 | Exceptional 57.7% |
| Immigrants | Iran | 100.0 /100 | #7 | Exceptional 57.7% |
| Thais | 100.0 /100 | #8 | Exceptional 57.4% |
| Immigrants | Israel | 100.0 /100 | #9 | Exceptional 56.8% |
| Cypriots | 100.0 /100 | #10 | Exceptional 56.4% |
| Immigrants | Australia | 100.0 /100 | #11 | Exceptional 55.8% |
| Immigrants | South Central Asia | 100.0 /100 | #12 | Exceptional 55.7% |
| Immigrants | China | 100.0 /100 | #13 | Exceptional 55.5% |
| Immigrants | Hong Kong | 100.0 /100 | #14 | Exceptional 55.4% |
| Immigrants | Eastern Asia | 100.0 /100 | #15 | Exceptional 55.4% |
Demographics Similar to Barbadians by Associate's Degree
In terms of associate's degree, the demographic groups most similar to Barbadians are Subsaharan African (43.9%, a difference of 0.10%), West Indian (43.8%, a difference of 0.24%), Immigrants from Western Africa (44.1%, a difference of 0.27%), Guamanian/Chamorro (43.8%, a difference of 0.39%), and Portuguese (44.1%, a difference of 0.47%).
| Demographics | Rating | Rank | Associate's Degree |
| Immigrants | Panama | 12.4 /100 | #215 | Poor 44.7% |
| Immigrants | Nigeria | 11.4 /100 | #216 | Poor 44.6% |
| Immigrants | Immigrants | 10.5 /100 | #217 | Poor 44.5% |
| Spanish | 9.4 /100 | #218 | Tragic 44.4% |
| Whites/Caucasians | 7.5 /100 | #219 | Tragic 44.2% |
| Portuguese | 7.2 /100 | #220 | Tragic 44.1% |
| Immigrants | Western Africa | 6.6 /100 | #221 | Tragic 44.1% |
| Barbadians | 5.8 /100 | #222 | Tragic 43.9% |
| Sub-Saharan Africans | 5.5 /100 | #223 | Tragic 43.9% |
| West Indians | 5.2 /100 | #224 | Tragic 43.8% |
| Guamanians/Chamorros | 4.8 /100 | #225 | Tragic 43.8% |
| Immigrants | Burma/Myanmar | 4.3 /100 | #226 | Tragic 43.7% |
| Trinidadians and Tobagonians | 4.0 /100 | #227 | Tragic 43.6% |
| Hmong | 3.2 /100 | #228 | Tragic 43.4% |
| Immigrants | Trinidad and Tobago | 3.0 /100 | #229 | Tragic 43.3% |