Okinawan vs Mongolian 10th Grade
COMPARE
Okinawan
Mongolian
10th Grade
10th Grade Comparison
Okinawans
Mongolians
94.8%
10TH GRADE
99.5/ 100
METRIC RATING
75th/ 347
METRIC RANK
94.0%
10TH GRADE
74.4/ 100
METRIC RATING
156th/ 347
METRIC RANK
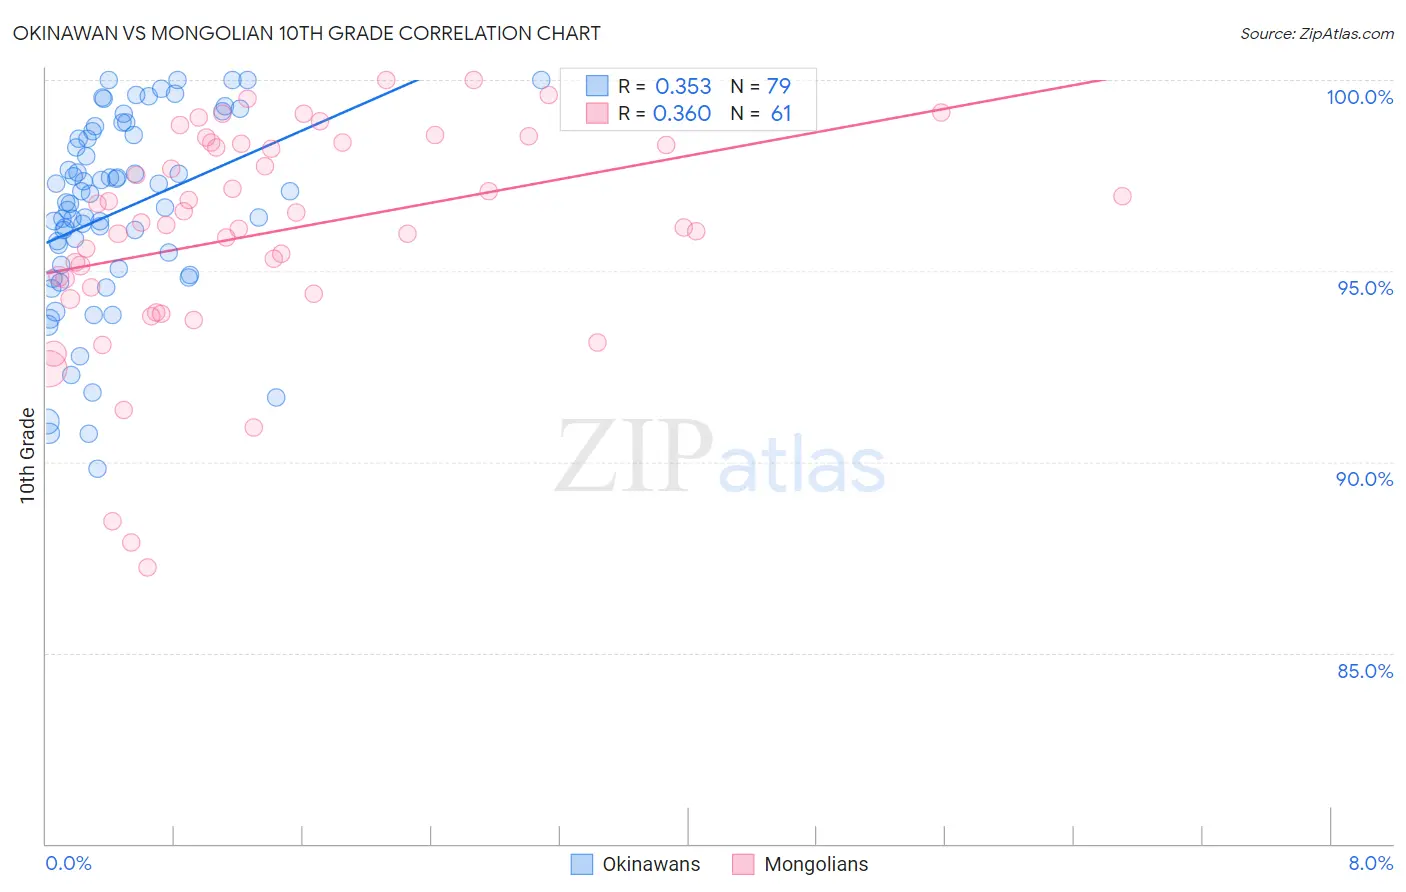
Okinawan vs Mongolian 10th Grade Correlation Chart
The statistical analysis conducted on geographies consisting of 73,779,368 people shows a mild positive correlation between the proportion of Okinawans and percentage of population with at least 10th grade education in the United States with a correlation coefficient (R) of 0.353 and weighted average of 94.8%. Similarly, the statistical analysis conducted on geographies consisting of 140,362,004 people shows a mild positive correlation between the proportion of Mongolians and percentage of population with at least 10th grade education in the United States with a correlation coefficient (R) of 0.360 and weighted average of 94.0%, a difference of 0.95%.
10th Grade Correlation Summary
| Measurement | Okinawan | Mongolian |
| Minimum | 89.8% | 87.2% |
| Maximum | 100.0% | 100.0% |
| Range | 10.2% | 12.8% |
| Mean | 96.6% | 96.0% |
| Median | 96.8% | 96.3% |
| Interquartile 25% (IQ1) | 95.1% | 94.5% |
| Interquartile 75% (IQ3) | 98.6% | 98.3% |
| Interquartile Range (IQR) | 3.5% | 3.9% |
| Standard Deviation (Sample) | 2.5% | 2.9% |
| Standard Deviation (Population) | 2.5% | 2.9% |
Similar Demographics by 10th Grade
Demographics Similar to Okinawans by 10th Grade
In terms of 10th grade, the demographic groups most similar to Okinawans are Romanian (94.8%, a difference of 0.010%), Immigrants from South Africa (94.8%, a difference of 0.010%), Bhutanese (94.9%, a difference of 0.030%), Canadian (94.9%, a difference of 0.030%), and Immigrants from Sweden (94.9%, a difference of 0.040%).
| Demographics | Rating | Rank | 10th Grade |
| Immigrants | Belgium | 99.7 /100 | #68 | Exceptional 94.9% |
| Immigrants | England | 99.6 /100 | #69 | Exceptional 94.9% |
| Zimbabweans | 99.6 /100 | #70 | Exceptional 94.9% |
| Alaska Natives | 99.6 /100 | #71 | Exceptional 94.9% |
| Immigrants | Sweden | 99.6 /100 | #72 | Exceptional 94.9% |
| Bhutanese | 99.6 /100 | #73 | Exceptional 94.9% |
| Canadians | 99.6 /100 | #74 | Exceptional 94.9% |
| Okinawans | 99.5 /100 | #75 | Exceptional 94.8% |
| Romanians | 99.5 /100 | #76 | Exceptional 94.8% |
| Immigrants | South Africa | 99.5 /100 | #77 | Exceptional 94.8% |
| Filipinos | 99.3 /100 | #78 | Exceptional 94.8% |
| Immigrants | Czechoslovakia | 99.2 /100 | #79 | Exceptional 94.7% |
| Immigrants | Denmark | 99.2 /100 | #80 | Exceptional 94.7% |
| Immigrants | Latvia | 99.2 /100 | #81 | Exceptional 94.7% |
| Swiss | 99.1 /100 | #82 | Exceptional 94.7% |
Demographics Similar to Mongolians by 10th Grade
In terms of 10th grade, the demographic groups most similar to Mongolians are Immigrants from Brazil (94.0%, a difference of 0.010%), Immigrants from Kenya (94.0%, a difference of 0.010%), Spanish (94.0%, a difference of 0.010%), Kiowa (93.9%, a difference of 0.010%), and Immigrants from Italy (94.0%, a difference of 0.040%).
| Demographics | Rating | Rank | 10th Grade |
| Ugandans | 80.7 /100 | #149 | Excellent 94.0% |
| Egyptians | 79.6 /100 | #150 | Good 94.0% |
| Kenyans | 79.1 /100 | #151 | Good 94.0% |
| Immigrants | Italy | 78.0 /100 | #152 | Good 94.0% |
| Immigrants | Brazil | 75.5 /100 | #153 | Good 94.0% |
| Immigrants | Kenya | 75.3 /100 | #154 | Good 94.0% |
| Spanish | 74.9 /100 | #155 | Good 94.0% |
| Mongolians | 74.4 /100 | #156 | Good 94.0% |
| Kiowa | 73.3 /100 | #157 | Good 93.9% |
| Bermudans | 71.0 /100 | #158 | Good 93.9% |
| Chileans | 70.2 /100 | #159 | Good 93.9% |
| Pakistanis | 70.1 /100 | #160 | Good 93.9% |
| Assyrians/Chaldeans/Syriacs | 69.7 /100 | #161 | Good 93.9% |
| Immigrants | Poland | 69.6 /100 | #162 | Good 93.9% |
| Venezuelans | 69.5 /100 | #163 | Good 93.9% |