Okinawan vs Immigrants from Sri Lanka 10th Grade
COMPARE
Okinawan
Immigrants from Sri Lanka
10th Grade
10th Grade Comparison
Okinawans
Immigrants from Sri Lanka
94.8%
10TH GRADE
99.5/ 100
METRIC RATING
75th/ 347
METRIC RANK
94.2%
10TH GRADE
89.9/ 100
METRIC RATING
138th/ 347
METRIC RANK
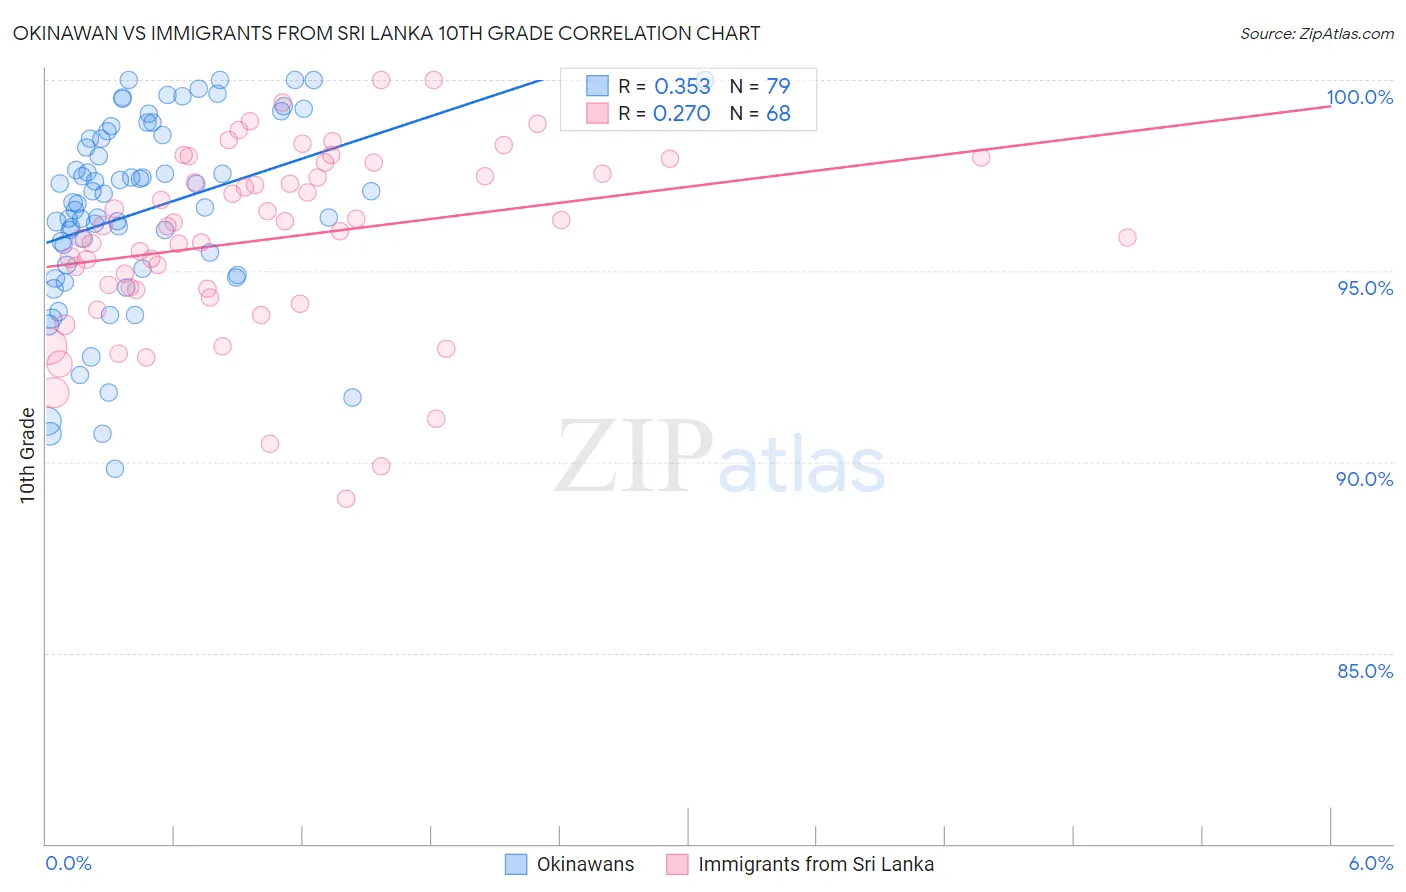
Okinawan vs Immigrants from Sri Lanka 10th Grade Correlation Chart
The statistical analysis conducted on geographies consisting of 73,779,368 people shows a mild positive correlation between the proportion of Okinawans and percentage of population with at least 10th grade education in the United States with a correlation coefficient (R) of 0.353 and weighted average of 94.8%. Similarly, the statistical analysis conducted on geographies consisting of 149,660,761 people shows a weak positive correlation between the proportion of Immigrants from Sri Lanka and percentage of population with at least 10th grade education in the United States with a correlation coefficient (R) of 0.270 and weighted average of 94.2%, a difference of 0.69%.
10th Grade Correlation Summary
| Measurement | Okinawan | Immigrants from Sri Lanka |
| Minimum | 89.8% | 89.0% |
| Maximum | 100.0% | 100.0% |
| Range | 10.2% | 11.0% |
| Mean | 96.6% | 95.8% |
| Median | 96.8% | 96.2% |
| Interquartile 25% (IQ1) | 95.1% | 94.5% |
| Interquartile 75% (IQ3) | 98.6% | 97.7% |
| Interquartile Range (IQR) | 3.5% | 3.2% |
| Standard Deviation (Sample) | 2.5% | 2.4% |
| Standard Deviation (Population) | 2.5% | 2.4% |
Similar Demographics by 10th Grade
Demographics Similar to Okinawans by 10th Grade
In terms of 10th grade, the demographic groups most similar to Okinawans are Romanian (94.8%, a difference of 0.010%), Immigrants from South Africa (94.8%, a difference of 0.010%), Bhutanese (94.9%, a difference of 0.030%), Canadian (94.9%, a difference of 0.030%), and Immigrants from Sweden (94.9%, a difference of 0.040%).
| Demographics | Rating | Rank | 10th Grade |
| Immigrants | Belgium | 99.7 /100 | #68 | Exceptional 94.9% |
| Immigrants | England | 99.6 /100 | #69 | Exceptional 94.9% |
| Zimbabweans | 99.6 /100 | #70 | Exceptional 94.9% |
| Alaska Natives | 99.6 /100 | #71 | Exceptional 94.9% |
| Immigrants | Sweden | 99.6 /100 | #72 | Exceptional 94.9% |
| Bhutanese | 99.6 /100 | #73 | Exceptional 94.9% |
| Canadians | 99.6 /100 | #74 | Exceptional 94.9% |
| Okinawans | 99.5 /100 | #75 | Exceptional 94.8% |
| Romanians | 99.5 /100 | #76 | Exceptional 94.8% |
| Immigrants | South Africa | 99.5 /100 | #77 | Exceptional 94.8% |
| Filipinos | 99.3 /100 | #78 | Exceptional 94.8% |
| Immigrants | Czechoslovakia | 99.2 /100 | #79 | Exceptional 94.7% |
| Immigrants | Denmark | 99.2 /100 | #80 | Exceptional 94.7% |
| Immigrants | Latvia | 99.2 /100 | #81 | Exceptional 94.7% |
| Swiss | 99.1 /100 | #82 | Exceptional 94.7% |
Demographics Similar to Immigrants from Sri Lanka by 10th Grade
In terms of 10th grade, the demographic groups most similar to Immigrants from Sri Lanka are Arapaho (94.2%, a difference of 0.010%), Immigrants from Bosnia and Herzegovina (94.2%, a difference of 0.010%), Shoshone (94.2%, a difference of 0.020%), Immigrants from Korea (94.2%, a difference of 0.040%), and Creek (94.2%, a difference of 0.050%).
| Demographics | Rating | Rank | 10th Grade |
| Immigrants | Eastern Europe | 92.5 /100 | #131 | Exceptional 94.3% |
| Immigrants | Russia | 92.4 /100 | #132 | Exceptional 94.3% |
| Creek | 91.9 /100 | #133 | Exceptional 94.2% |
| Osage | 91.7 /100 | #134 | Exceptional 94.2% |
| Immigrants | Korea | 91.3 /100 | #135 | Exceptional 94.2% |
| Shoshone | 90.8 /100 | #136 | Exceptional 94.2% |
| Arapaho | 90.5 /100 | #137 | Exceptional 94.2% |
| Immigrants | Sri Lanka | 89.9 /100 | #138 | Excellent 94.2% |
| Immigrants | Bosnia and Herzegovina | 89.4 /100 | #139 | Excellent 94.2% |
| Immigrants | Jordan | 87.6 /100 | #140 | Excellent 94.1% |
| Hmong | 86.6 /100 | #141 | Excellent 94.1% |
| Albanians | 86.5 /100 | #142 | Excellent 94.1% |
| Cherokee | 84.9 /100 | #143 | Excellent 94.1% |
| Immigrants | Kazakhstan | 84.9 /100 | #144 | Excellent 94.1% |
| Immigrants | Nonimmigrants | 83.8 /100 | #145 | Excellent 94.1% |