Norwegian vs Peruvian Associate's Degree
COMPARE
Norwegian
Peruvian
Associate's Degree
Associate's Degree Comparison
Norwegians
Peruvians
47.6%
ASSOCIATE'S DEGREE
81.0/ 100
METRIC RATING
143rd/ 347
METRIC RANK
46.4%
ASSOCIATE'S DEGREE
50.5/ 100
METRIC RATING
172nd/ 347
METRIC RANK
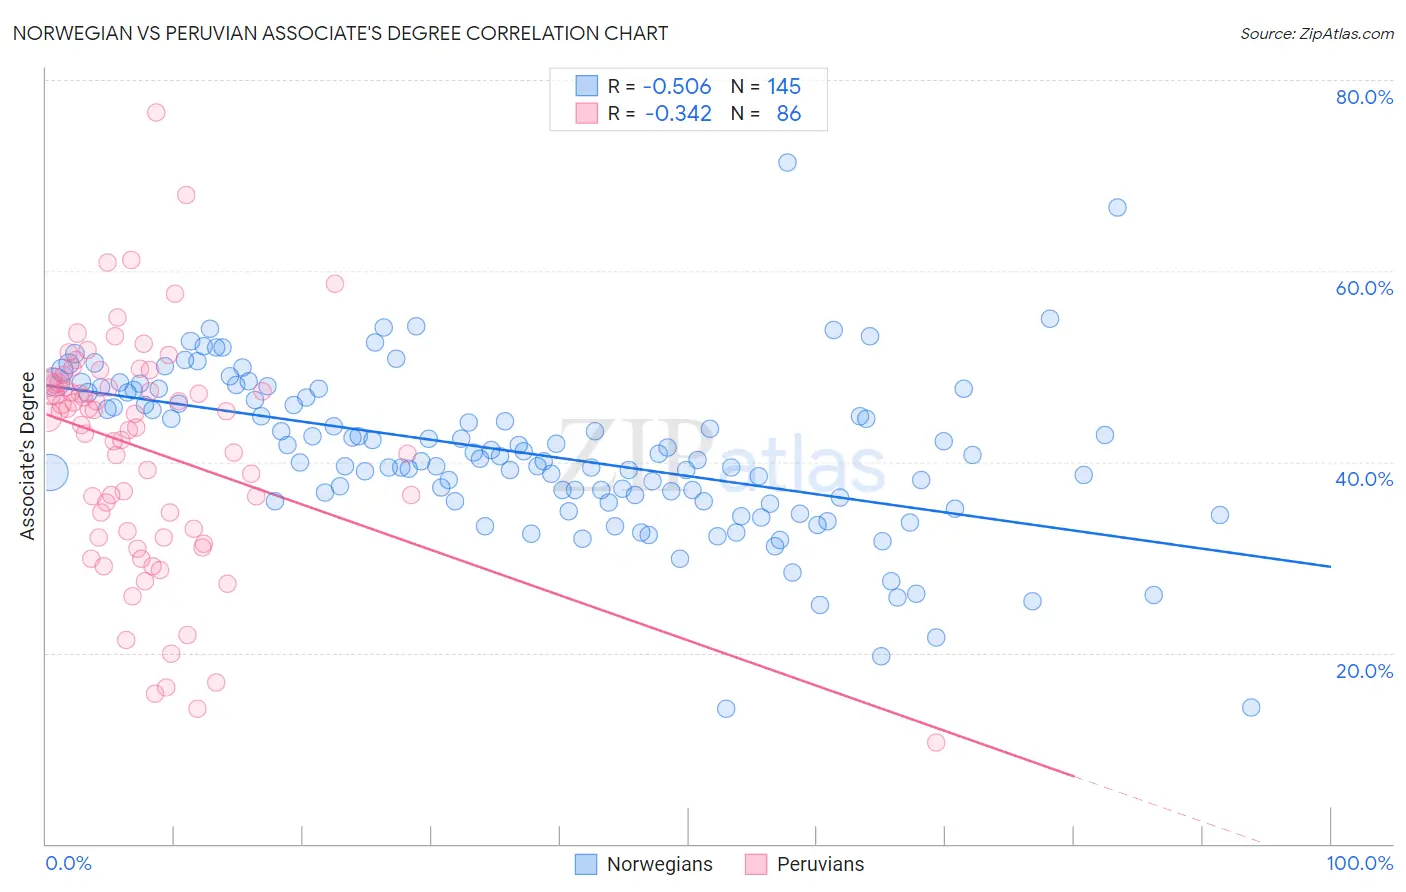
Norwegian vs Peruvian Associate's Degree Correlation Chart
The statistical analysis conducted on geographies consisting of 533,342,893 people shows a substantial negative correlation between the proportion of Norwegians and percentage of population with at least associate's degree education in the United States with a correlation coefficient (R) of -0.506 and weighted average of 47.6%. Similarly, the statistical analysis conducted on geographies consisting of 363,234,961 people shows a mild negative correlation between the proportion of Peruvians and percentage of population with at least associate's degree education in the United States with a correlation coefficient (R) of -0.342 and weighted average of 46.4%, a difference of 2.7%.
Associate's Degree Correlation Summary
| Measurement | Norwegian | Peruvian |
| Minimum | 14.2% | 10.6% |
| Maximum | 71.4% | 76.6% |
| Range | 57.2% | 66.0% |
| Mean | 40.9% | 41.3% |
| Median | 40.6% | 44.9% |
| Interquartile 25% (IQ1) | 35.9% | 32.7% |
| Interquartile 75% (IQ3) | 47.3% | 48.1% |
| Interquartile Range (IQR) | 11.4% | 15.5% |
| Standard Deviation (Sample) | 8.6% | 12.1% |
| Standard Deviation (Population) | 8.6% | 12.0% |
Similar Demographics by Associate's Degree
Demographics Similar to Norwegians by Associate's Degree
In terms of associate's degree, the demographic groups most similar to Norwegians are Slavic (47.6%, a difference of 0.060%), Sierra Leonean (47.7%, a difference of 0.23%), Canadian (47.5%, a difference of 0.23%), Taiwanese (47.7%, a difference of 0.28%), and Immigrants from Sudan (47.4%, a difference of 0.36%).
| Demographics | Rating | Rank | Associate's Degree |
| Pakistanis | 88.0 /100 | #136 | Excellent 48.1% |
| Immigrants | Eritrea | 87.8 /100 | #137 | Excellent 48.1% |
| Poles | 87.3 /100 | #138 | Excellent 48.0% |
| Slovenes | 85.1 /100 | #139 | Excellent 47.9% |
| Immigrants | Southern Europe | 84.4 /100 | #140 | Excellent 47.8% |
| Taiwanese | 83.3 /100 | #141 | Excellent 47.7% |
| Sierra Leoneans | 82.9 /100 | #142 | Excellent 47.7% |
| Norwegians | 81.0 /100 | #143 | Excellent 47.6% |
| Slavs | 80.5 /100 | #144 | Excellent 47.6% |
| Canadians | 79.0 /100 | #145 | Good 47.5% |
| Immigrants | Sudan | 77.9 /100 | #146 | Good 47.4% |
| Danes | 77.3 /100 | #147 | Good 47.4% |
| South American Indians | 76.7 /100 | #148 | Good 47.4% |
| Immigrants | Armenia | 76.6 /100 | #149 | Good 47.4% |
| Iraqis | 76.2 /100 | #150 | Good 47.4% |
Demographics Similar to Peruvians by Associate's Degree
In terms of associate's degree, the demographic groups most similar to Peruvians are Immigrants from Iraq (46.4%, a difference of 0.020%), English (46.4%, a difference of 0.040%), Belgian (46.3%, a difference of 0.12%), Finnish (46.3%, a difference of 0.15%), and Slovak (46.3%, a difference of 0.16%).
| Demographics | Rating | Rank | Associate's Degree |
| Immigrants | South America | 59.9 /100 | #165 | Average 46.7% |
| Hungarians | 59.3 /100 | #166 | Average 46.7% |
| Immigrants | Sierra Leone | 59.2 /100 | #167 | Average 46.7% |
| Immigrants | Somalia | 55.5 /100 | #168 | Average 46.5% |
| Uruguayans | 55.4 /100 | #169 | Average 46.5% |
| Irish | 53.6 /100 | #170 | Average 46.5% |
| Basques | 52.8 /100 | #171 | Average 46.5% |
| Peruvians | 50.5 /100 | #172 | Average 46.4% |
| Immigrants | Iraq | 50.3 /100 | #173 | Average 46.4% |
| English | 50.0 /100 | #174 | Average 46.4% |
| Belgians | 48.9 /100 | #175 | Average 46.3% |
| Finns | 48.5 /100 | #176 | Average 46.3% |
| Slovaks | 48.4 /100 | #177 | Average 46.3% |
| Immigrants | Bosnia and Herzegovina | 48.3 /100 | #178 | Average 46.3% |
| Sri Lankans | 47.6 /100 | #179 | Average 46.3% |