Nonimmigrants vs Chilean Doctorate Degree

COMPARE

Nonimmigrants
Race
Ancestry
AfghanAfricanAlaska NativeAlaskan AthabascanAlbanianAleutAlsatianAmericanApacheArabArapahoArgentineanArmenianAssyrian/Chaldean/SyriacAustralianAustrianBahamianBangladeshiBarbadianBasqueBelgianBelizeanBermudanBhutaneseBlackfeetBolivianBrazilianBritishBritish West IndianBulgarianBurmeseCajunCambodianCanadianCape VerdeanCarpatho RusynCelticCentral AmericanCentral American IndianCherokeeCheyenneChickasawChineseChippewaChoctawColombianColvilleComancheCosta RicanCreeCreekCroatianCrowCubanCypriotCzechCzechoslovakianDanishDelawareDominicanDutchDutch West IndianEastern EuropeanEcuadorianEgyptianEnglishEstonianEthiopianEuropeanFijianFilipinoFinnishFrenchFrench American IndianFrench CanadianGermanGerman RussianGhanaianGreekGuamanian/ChamorroGuatemalanGuyaneseHaitianHmongHonduranHopiHoumaHungarianIcelanderIndian (Asian)IndonesianInupiatIranianIraqiIrishIroquoisIsraeliItalianJamaicanJapaneseJordanianKenyanKiowaKoreanLaotianLatvianLebaneseLiberianLithuanianLumbeeLuxembourgerMacedonianMalaysianMalteseMarshalleseMenomineeMexicanMexican American IndianMongolianMoroccanNative HawaiianNavajoNepaleseNew ZealanderNicaraguanNigerianNorthern EuropeanNorwegianOkinawanOsageOttawaPaiutePakistaniPalestinianPanamanianParaguayanPennsylvania GermanPeruvianPimaPolishPortuguesePotawatomiPuebloPuerto RicanPuget Sound SalishRomanianRussianSalvadoranSamoanScandinavianScotch-IrishScottishSeminoleSenegaleseSerbianShoshoneSierra LeoneanSiouxSlavicSlovakSloveneSomaliSouth AfricanSouth AmericanSouth American IndianSoviet UnionSpaniardSpanishSpanish AmericanSpanish American IndianSri LankanSubsaharan AfricanSudaneseSwedishSwissSyrianTaiwaneseThaiTlingit-HaidaTohono O'OdhamTonganTrinidadian and TobagonianTsimshianTurkishU.S. Virgin IslanderUgandanUkrainianUruguayanUteVenezuelanVietnameseWelshWest IndianYakamaYaquiYugoslavianYumanYup'ikZimbabwean
Immigration
NonimmigrantsImmigrantsAfghanistanAfricaAlbaniaArgentinaArmeniaAsiaAustraliaAustriaBahamasBangladeshBarbadosBelarusBelgiumBelizeBoliviaBosnia and HerzegovinaBrazilBulgariaBurma/MyanmarCabo VerdeCambodiaCameroonCanadaCaribbeanCentral AmericaChileChinaColombiaCongoCosta RicaCroatiaCubaCzechoslovakiaDenmarkDominicaDominican RepublicEastern AfricaEastern AsiaEastern EuropeEcuadorEgyptEl SalvadorEnglandEritreaEthiopiaEuropeFijiFranceGermanyGhanaGreeceGrenadaGuatemalaGuyanaHaitiHondurasHong KongHungaryIndiaIndonesiaIranIraqIrelandIsraelItalyJamaicaJapanJordanKazakhstanKenyaKoreaKuwaitLaosLatin AmericaLatviaLebanonLiberiaLithuaniaMalaysiaMexicoMicronesiaMiddle AfricaMoldovaMoroccoNepalNetherlandsNicaraguaNigeriaNorth AmericaNorth MacedoniaNorthern AfricaNorthern EuropeNorwayOceaniaPakistanPanamaPeruPhilippinesPolandPortugalRomaniaRussiaSaudi ArabiaScotlandSenegalSerbiaSierra LeoneSingaporeSomaliaSouth AfricaSouth AmericaSouth Central AsiaSouth Eastern AsiaSouthern EuropeSpainSri LankaSt. Vincent and the GrenadinesSudanSwedenSwitzerlandSyriaTaiwanThailandTrinidad and TobagoTurkeyUgandaUkraineUruguayUzbekistanVenezuelaVietnamWest IndiesWestern AfricaWestern AsiaWestern EuropeYemenZaireZimbabweAzores
Chilean
Race
Ancestry
AfghanAfricanAlaska NativeAlaskan AthabascanAlbanianAleutAlsatianAmericanApacheArabArapahoArgentineanArmenianAssyrian/Chaldean/SyriacAustralianAustrianBahamianBangladeshiBarbadianBasqueBelgianBelizeanBermudanBhutaneseBlackfeetBolivianBrazilianBritishBritish West IndianBulgarianBurmeseCajunCambodianCanadianCape VerdeanCarpatho RusynCelticCentral AmericanCentral American IndianCherokeeCheyenneChickasawChileanChineseChippewaChoctawColombianColvilleComancheCosta RicanCreeCreekCroatianCrowCubanCypriotCzechCzechoslovakianDanishDelawareDominicanDutchDutch West IndianEastern EuropeanEcuadorianEgyptianEnglishEstonianEthiopianEuropeanFijianFilipinoFinnishFrenchFrench American IndianFrench CanadianGermanGerman RussianGhanaianGreekGuamanian/ChamorroGuatemalanGuyaneseHaitianHmongHonduranHopiHoumaHungarianIcelanderIndian (Asian)IndonesianInupiatIranianIraqiIrishIroquoisIsraeliItalianJamaicanJapaneseJordanianKenyanKiowaKoreanLaotianLatvianLebaneseLiberianLithuanianLumbeeLuxembourgerMacedonianMalaysianMalteseMarshalleseMenomineeMexicanMexican American IndianMongolianMoroccanNative HawaiianNavajoNepaleseNew ZealanderNicaraguanNigerianNorthern EuropeanNorwegianOkinawanOsageOttawaPaiutePakistaniPalestinianPanamanianParaguayanPennsylvania GermanPeruvianPimaPolishPortuguesePotawatomiPuebloPuerto RicanPuget Sound SalishRomanianRussianSalvadoranSamoanScandinavianScotch-IrishScottishSeminoleSenegaleseSerbianShoshoneSierra LeoneanSiouxSlavicSlovakSloveneSomaliSouth AfricanSouth AmericanSouth American IndianSoviet UnionSpaniardSpanishSpanish AmericanSpanish American IndianSri LankanSubsaharan AfricanSudaneseSwedishSwissSyrianTaiwaneseThaiTlingit-HaidaTohono O'OdhamTonganTrinidadian and TobagonianTsimshianTurkishU.S. Virgin IslanderUgandanUkrainianUruguayanUteVenezuelanVietnameseWelshWest IndianYakamaYaquiYugoslavianYumanYup'ikZimbabwean
Immigration
ImmigrantsAfghanistanAfricaAlbaniaArgentinaArmeniaAsiaAustraliaAustriaBahamasBangladeshBarbadosBelarusBelgiumBelizeBoliviaBosnia and HerzegovinaBrazilBulgariaBurma/MyanmarCabo VerdeCambodiaCameroonCanadaCaribbeanCentral AmericaChileChinaColombiaCongoCosta RicaCroatiaCubaCzechoslovakiaDenmarkDominicaDominican RepublicEastern AfricaEastern AsiaEastern EuropeEcuadorEgyptEl SalvadorEnglandEritreaEthiopiaEuropeFijiFranceGermanyGhanaGreeceGrenadaGuatemalaGuyanaHaitiHondurasHong KongHungaryIndiaIndonesiaIranIraqIrelandIsraelItalyJamaicaJapanJordanKazakhstanKenyaKoreaKuwaitLaosLatin AmericaLatviaLebanonLiberiaLithuaniaMalaysiaMexicoMicronesiaMiddle AfricaMoldovaMoroccoNepalNetherlandsNicaraguaNigeriaNorth AmericaNorth MacedoniaNorthern AfricaNorthern EuropeNorwayOceaniaPakistanPanamaPeruPhilippinesPolandPortugalRomaniaRussiaSaudi ArabiaScotlandSenegalSerbiaSierra LeoneSingaporeSomaliaSouth AfricaSouth AmericaSouth Central AsiaSouth Eastern AsiaSouthern EuropeSpainSri LankaSt. Vincent and the GrenadinesSudanSwedenSwitzerlandSyriaTaiwanThailandTrinidad and TobagoTurkeyUgandaUkraineUruguayUzbekistanVenezuelaVietnamWest IndiesWestern AfricaWestern AsiaWestern EuropeYemenZaireZimbabweAzores
Doctorate Degree
Income
Poverty
Unemployment
Labor Participation
Family Structure
Vehicle Availability
Education Level
Disability

Doctorate Degree Comparison

Nonimmigrants

Chileans

Tragic
Exceptional
1.7%
DOCTORATE DEGREE
8.8/ 100
METRIC RATING
221st/ 347
METRIC RANK
2.2%
DOCTORATE DEGREE
99.1/ 100
METRIC RATING
92nd/ 347
METRIC RANK

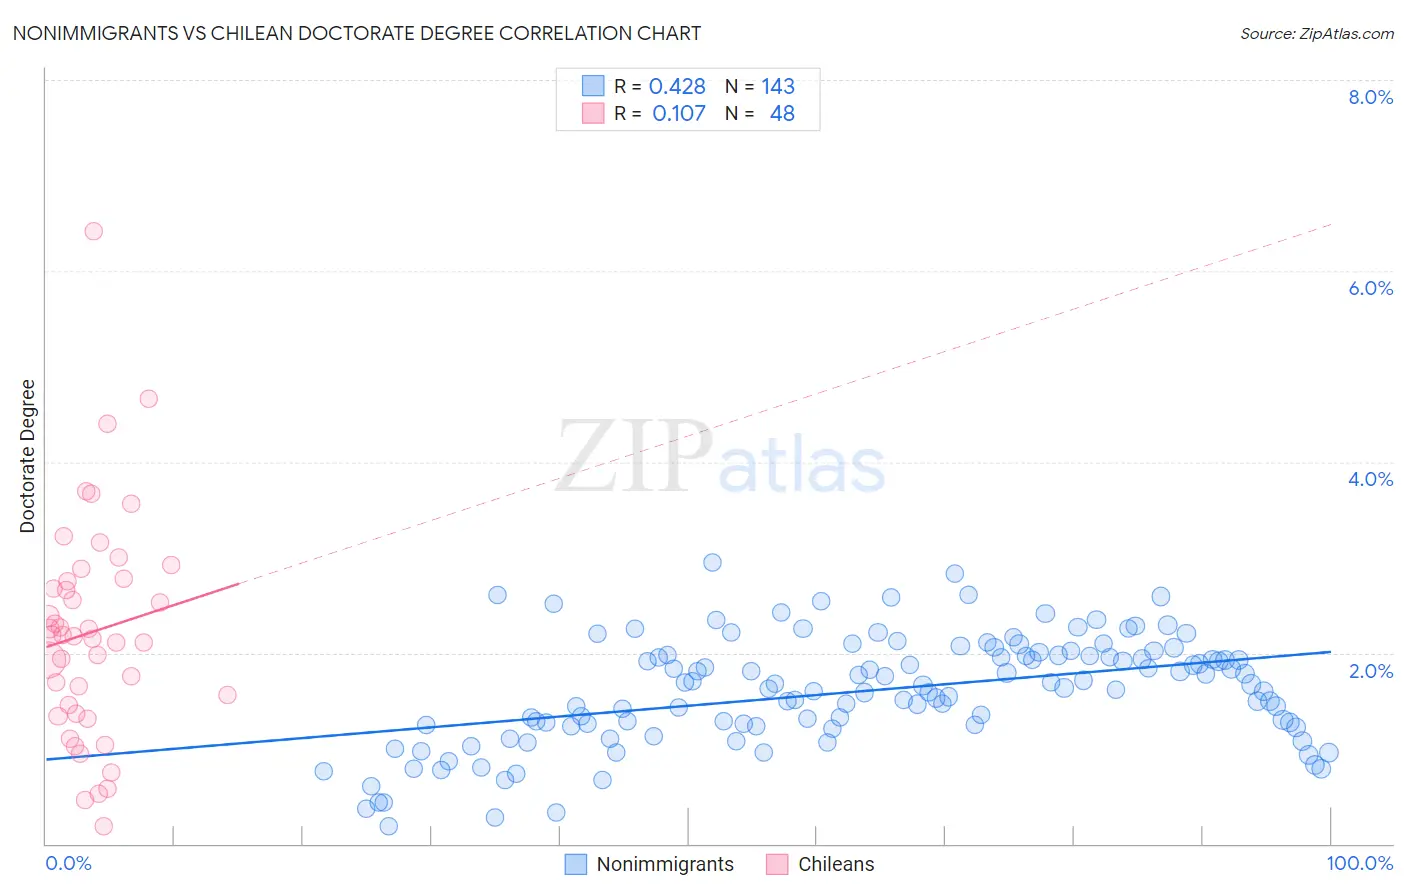
Nonimmigrants vs Chilean Doctorate Degree Correlation Chart

The statistical analysis conducted on geographies consisting of 553,265,434 people shows a moderate positive correlation between the proportion of Nonimmigrants and percentage of population with at least doctorate degree education in the United States with a correlation coefficient (R) of 0.428 and weighted average of 1.7%. Similarly, the statistical analysis conducted on geographies consisting of 255,786,366 people shows a poor positive correlation between the proportion of Chileans and percentage of population with at least doctorate degree education in the United States with a correlation coefficient (R) of 0.107 and weighted average of 2.2%, a difference of 28.0%.
Nonimmigrants vs Chilean Doctorate Degree

Doctorate Degree Correlation Summary

MeasurementNonimmigrantsChilean
Minimum0.18%0.19%
Maximum2.9%6.4%
Range2.8%6.2%
Mean1.6%2.2%
Median1.7%2.2%
Interquartile 25% (IQ1)1.2%1.4%
Interquartile 75% (IQ3)2.0%2.8%
Interquartile Range (IQR)0.73%1.4%
Standard Deviation (Sample)0.57%1.2%
Standard Deviation (Population)0.56%1.2%

Similar Demographics by Doctorate Degree

Demographics Similar to Nonimmigrants by Doctorate Degree

In terms of doctorate degree, the demographic groups most similar to Nonimmigrants are Immigrants from Venezuela (1.7%, a difference of 0.070%), Immigrants from Uruguay (1.7%, a difference of 0.19%), Immigrants from Bosnia and Herzegovina (1.7%, a difference of 0.53%), Immigrants from Poland (1.7%, a difference of 0.75%), and Immigrants from Iraq (1.7%, a difference of 0.85%).
DemographicsRating | RankDoctorate Degree
Pueblo
14.2
/100
|
#214
Poor
1.7%
Alaskan Athabascans
13.8
/100
|
#215
Poor
1.7%
Immigrants | Burma/Myanmar
13.5
/100
|
#216
Poor
1.7%
Spanish Americans
12.9
/100
|
#217
Poor
1.7%
Tlingit-Haida
11.9
/100
|
#218
Poor
1.7%
Immigrants | Iraq
10.7
/100
|
#219
Poor
1.7%
Immigrants | Uruguay
9.2
/100
|
#220
Tragic
1.7%
Immigrants | Nonimmigrants
8.8
/100
|
#221
Tragic
1.7%
Immigrants | Venezuela
8.7
/100
|
#222
Tragic
1.7%
Immigrants | Bosnia and Herzegovina
7.8
/100
|
#223
Tragic
1.7%
Immigrants | Poland
7.4
/100
|
#224
Tragic
1.7%
Immigrants | Colombia
6.7
/100
|
#225
Tragic
1.7%
Osage
6.5
/100
|
#226
Tragic
1.7%
Panamanians
6.3
/100
|
#227
Tragic
1.7%
Assyrians/Chaldeans/Syriacs
5.9
/100
|
#228
Tragic
1.7%

Demographics Similar to Chileans by Doctorate Degree

In terms of doctorate degree, the demographic groups most similar to Chileans are Alsatian (2.1%, a difference of 0.22%), Immigrants from Sudan (2.2%, a difference of 0.26%), Immigrants from Scotland (2.2%, a difference of 0.73%), British (2.2%, a difference of 0.75%), and Greek (2.1%, a difference of 0.85%).
DemographicsRating | RankDoctorate Degree
Immigrants | Brazil
99.6
/100
|
#85
Exceptional
2.2%
Egyptians
99.4
/100
|
#86
Exceptional
2.2%
Immigrants | Zimbabwe
99.4
/100
|
#87
Exceptional
2.2%
Immigrants | Nepal
99.3
/100
|
#88
Exceptional
2.2%
British
99.3
/100
|
#89
Exceptional
2.2%
Immigrants | Scotland
99.2
/100
|
#90
Exceptional
2.2%
Immigrants | Sudan
99.1
/100
|
#91
Exceptional
2.2%
Chileans
99.1
/100
|
#92
Exceptional
2.2%
Alsatians
99.0
/100
|
#93
Exceptional
2.1%
Greeks
98.8
/100
|
#94
Exceptional
2.1%
Immigrants | Romania
98.7
/100
|
#95
Exceptional
2.1%
Immigrants | Northern Africa
98.4
/100
|
#96
Exceptional
2.1%
Immigrants | Eritrea
98.4
/100
|
#97
Exceptional
2.1%
Armenians
98.3
/100
|
#98
Exceptional
2.1%
Immigrants | Egypt
98.2
/100
|
#99
Exceptional
2.1%