Swedish vs Belizean Bachelor's Degree

COMPARE

Swedish
Race
Ancestry
AfghanAfricanAlaska NativeAlaskan AthabascanAlbanianAleutAlsatianAmericanApacheArabArapahoArgentineanArmenianAssyrian/Chaldean/SyriacAustralianAustrianBahamianBangladeshiBarbadianBasqueBelgianBermudanBhutaneseBlackfeetBolivianBrazilianBritishBritish West IndianBulgarianBurmeseCajunCambodianCanadianCape VerdeanCarpatho RusynCelticCentral AmericanCentral American IndianCherokeeCheyenneChickasawChileanChineseChippewaChoctawColombianColvilleComancheCosta RicanCreeCreekCroatianCrowCubanCypriotCzechCzechoslovakianDanishDelawareDominicanDutchDutch West IndianEastern EuropeanEcuadorianEgyptianEnglishEstonianEthiopianEuropeanFijianFilipinoFinnishFrenchFrench American IndianFrench CanadianGermanGerman RussianGhanaianGreekGuamanian/ChamorroGuatemalanGuyaneseHaitianHmongHonduranHopiHoumaHungarianIcelanderIndian (Asian)IndonesianInupiatIranianIraqiIrishIroquoisIsraeliItalianJamaicanJapaneseJordanianKenyanKiowaKoreanLaotianLatvianLebaneseLiberianLithuanianLumbeeLuxembourgerMacedonianMalaysianMalteseMarshalleseMenomineeMexicanMexican American IndianMongolianMoroccanNative HawaiianNavajoNepaleseNew ZealanderNicaraguanNigerianNorthern EuropeanNorwegianOkinawanOsageOttawaPaiutePakistaniPalestinianPanamanianParaguayanPennsylvania GermanPeruvianPimaPolishPortuguesePotawatomiPuebloPuerto RicanPuget Sound SalishRomanianRussianSalvadoranSamoanScandinavianScotch-IrishScottishSeminoleSenegaleseSerbianShoshoneSierra LeoneanSiouxSlavicSlovakSloveneSomaliSouth AfricanSouth AmericanSouth American IndianSoviet UnionSpaniardSpanishSpanish AmericanSpanish American IndianSri LankanSubsaharan AfricanSudaneseSwedishSwissSyrianTaiwaneseThaiTlingit-HaidaTohono O'OdhamTonganTrinidadian and TobagonianTsimshianTurkishU.S. Virgin IslanderUgandanUkrainianUruguayanUteVenezuelanVietnameseWelshWest IndianYakamaYaquiYugoslavianYumanYup'ikZimbabwean
Immigration
NonimmigrantsImmigrantsAfghanistanAfricaAlbaniaArgentinaArmeniaAsiaAustraliaAustriaBahamasBangladeshBarbadosBelarusBelgiumBelizeBoliviaBosnia and HerzegovinaBrazilBulgariaBurma/MyanmarCabo VerdeCambodiaCameroonCanadaCaribbeanCentral AmericaChileChinaColombiaCongoCosta RicaCroatiaCubaCzechoslovakiaDenmarkDominicaDominican RepublicEastern AfricaEastern AsiaEastern EuropeEcuadorEgyptEl SalvadorEnglandEritreaEthiopiaEuropeFijiFranceGermanyGhanaGreeceGrenadaGuatemalaGuyanaHaitiHondurasHong KongHungaryIndiaIndonesiaIranIraqIrelandIsraelItalyJamaicaJapanJordanKazakhstanKenyaKoreaKuwaitLaosLatin AmericaLatviaLebanonLiberiaLithuaniaMalaysiaMexicoMicronesiaMiddle AfricaMoldovaMoroccoNepalNetherlandsNicaraguaNigeriaNorth AmericaNorth MacedoniaNorthern AfricaNorthern EuropeNorwayOceaniaPakistanPanamaPeruPhilippinesPolandPortugalRomaniaRussiaSaudi ArabiaScotlandSenegalSerbiaSierra LeoneSingaporeSomaliaSouth AfricaSouth AmericaSouth Central AsiaSouth Eastern AsiaSouthern EuropeSpainSri LankaSt. Vincent and the GrenadinesSudanSwedenSwitzerlandSyriaTaiwanThailandTrinidad and TobagoTurkeyUgandaUkraineUruguayUzbekistanVenezuelaVietnamWest IndiesWestern AfricaWestern AsiaWestern EuropeYemenZaireZimbabweAzores
Belizean
Race
Ancestry
AfghanAfricanAlaska NativeAlaskan AthabascanAlbanianAleutAlsatianAmericanApacheArabArapahoArgentineanArmenianAssyrian/Chaldean/SyriacAustralianAustrianBahamianBangladeshiBarbadianBasqueBelgianBelizeanBermudanBhutaneseBlackfeetBolivianBrazilianBritishBritish West IndianBulgarianBurmeseCajunCambodianCanadianCape VerdeanCarpatho RusynCelticCentral AmericanCentral American IndianCherokeeCheyenneChickasawChileanChineseChippewaChoctawColombianColvilleComancheCosta RicanCreeCreekCroatianCrowCubanCypriotCzechCzechoslovakianDanishDelawareDominicanDutchDutch West IndianEastern EuropeanEcuadorianEgyptianEnglishEstonianEthiopianEuropeanFijianFilipinoFinnishFrenchFrench American IndianFrench CanadianGermanGerman RussianGhanaianGreekGuamanian/ChamorroGuatemalanGuyaneseHaitianHmongHonduranHopiHoumaHungarianIcelanderIndian (Asian)IndonesianInupiatIranianIraqiIrishIroquoisIsraeliItalianJamaicanJapaneseJordanianKenyanKiowaKoreanLaotianLatvianLebaneseLiberianLithuanianLumbeeLuxembourgerMacedonianMalaysianMalteseMarshalleseMenomineeMexicanMexican American IndianMongolianMoroccanNative HawaiianNavajoNepaleseNew ZealanderNicaraguanNigerianNorthern EuropeanNorwegianOkinawanOsageOttawaPaiutePakistaniPalestinianPanamanianParaguayanPennsylvania GermanPeruvianPimaPolishPortuguesePotawatomiPuebloPuerto RicanPuget Sound SalishRomanianRussianSalvadoranSamoanScandinavianScotch-IrishScottishSeminoleSenegaleseSerbianShoshoneSierra LeoneanSiouxSlavicSlovakSloveneSomaliSouth AfricanSouth AmericanSouth American IndianSoviet UnionSpaniardSpanishSpanish AmericanSpanish American IndianSri LankanSubsaharan AfricanSudaneseSwissSyrianTaiwaneseThaiTlingit-HaidaTohono O'OdhamTonganTrinidadian and TobagonianTsimshianTurkishU.S. Virgin IslanderUgandanUkrainianUruguayanUteVenezuelanVietnameseWelshWest IndianYakamaYaquiYugoslavianYumanYup'ikZimbabwean
Immigration
NonimmigrantsImmigrantsAfghanistanAfricaAlbaniaArgentinaArmeniaAsiaAustraliaAustriaBahamasBangladeshBarbadosBelarusBelgiumBelizeBoliviaBosnia and HerzegovinaBrazilBulgariaBurma/MyanmarCabo VerdeCambodiaCameroonCanadaCaribbeanCentral AmericaChileChinaColombiaCongoCosta RicaCroatiaCubaCzechoslovakiaDenmarkDominicaDominican RepublicEastern AfricaEastern AsiaEastern EuropeEcuadorEgyptEl SalvadorEnglandEritreaEthiopiaEuropeFijiFranceGermanyGhanaGreeceGrenadaGuatemalaGuyanaHaitiHondurasHong KongHungaryIndiaIndonesiaIranIraqIrelandIsraelItalyJamaicaJapanJordanKazakhstanKenyaKoreaKuwaitLaosLatin AmericaLatviaLebanonLiberiaLithuaniaMalaysiaMexicoMicronesiaMiddle AfricaMoldovaMoroccoNepalNetherlandsNicaraguaNigeriaNorth AmericaNorth MacedoniaNorthern AfricaNorthern EuropeNorwayOceaniaPakistanPanamaPeruPhilippinesPolandPortugalRomaniaRussiaSaudi ArabiaScotlandSenegalSerbiaSierra LeoneSingaporeSomaliaSouth AfricaSouth AmericaSouth Central AsiaSouth Eastern AsiaSouthern EuropeSpainSri LankaSt. Vincent and the GrenadinesSudanSwedenSwitzerlandSyriaTaiwanThailandTrinidad and TobagoTurkeyUgandaUkraineUruguayUzbekistanVenezuelaVietnamWest IndiesWestern AfricaWestern AsiaWestern EuropeYemenZaireZimbabweAzores
Bachelor's Degree
Income
Poverty
Unemployment
Labor Participation
Family Structure
Vehicle Availability
Education Level
Disability

Bachelor's Degree Comparison

Swedes

Belizeans

Good
Tragic
39.1%
BACHELOR'S DEGREE
79.2/ 100
METRIC RATING
146th/ 347
METRIC RANK
32.8%
BACHELOR'S DEGREE
0.4/ 100
METRIC RATING
263rd/ 347
METRIC RANK

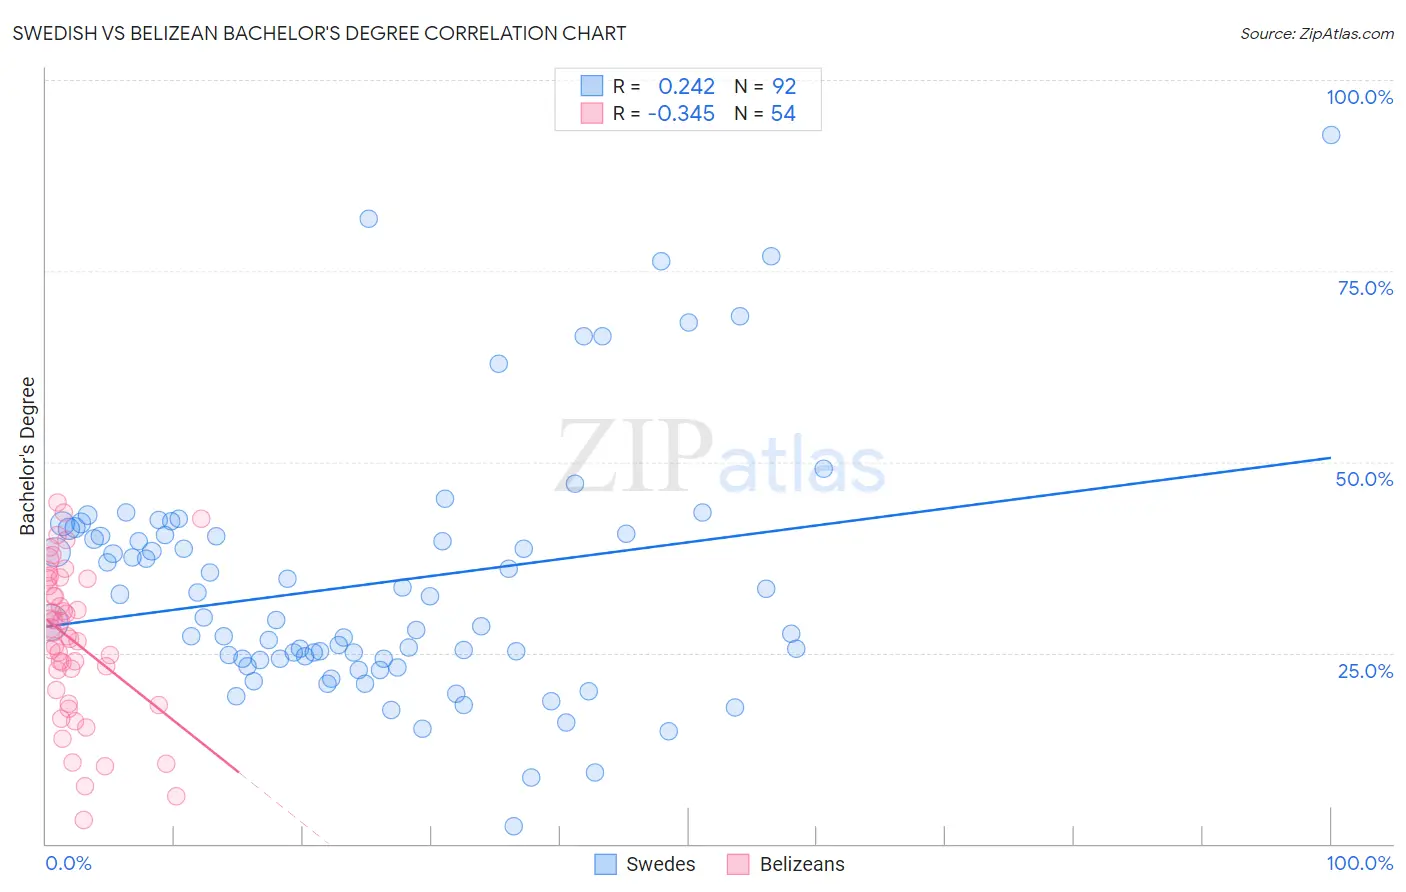
Swedish vs Belizean Bachelor's Degree Correlation Chart

The statistical analysis conducted on geographies consisting of 539,155,102 people shows a weak positive correlation between the proportion of Swedes and percentage of population with at least bachelor's degree education in the United States with a correlation coefficient (R) of 0.242 and weighted average of 39.1%. Similarly, the statistical analysis conducted on geographies consisting of 144,217,476 people shows a mild negative correlation between the proportion of Belizeans and percentage of population with at least bachelor's degree education in the United States with a correlation coefficient (R) of -0.345 and weighted average of 32.8%, a difference of 19.1%.
Swedish vs Belizean Bachelor's Degree

Bachelor's Degree Correlation Summary

MeasurementSwedishBelizean
Minimum2.3%3.1%
Maximum92.9%44.8%
Range90.6%41.6%
Mean34.1%26.6%
Median29.4%27.4%
Interquartile 25% (IQ1)24.2%20.1%
Interquartile 75% (IQ3)40.5%34.7%
Interquartile Range (IQR)16.3%14.6%
Standard Deviation (Sample)16.3%10.0%
Standard Deviation (Population)16.2%9.9%

Similar Demographics by Bachelor's Degree

Demographics Similar to Swedes by Bachelor's Degree

In terms of bachelor's degree, the demographic groups most similar to Swedes are Immigrants from Sierra Leone (39.0%, a difference of 0.030%), Slovene (39.1%, a difference of 0.040%), Immigrants from Afghanistan (39.1%, a difference of 0.070%), Polish (39.1%, a difference of 0.090%), and Iraqi (39.0%, a difference of 0.17%).
DemographicsRating | RankBachelor's Degree
Immigrants | Sudan
84.5
/100
|
#139
Excellent
39.4%
Immigrants | Armenia
84.1
/100
|
#140
Excellent
39.4%
South American Indians
83.6
/100
|
#141
Excellent
39.3%
Immigrants | North Macedonia
81.6
/100
|
#142
Excellent
39.2%
Poles
79.8
/100
|
#143
Good
39.1%
Immigrants | Afghanistan
79.7
/100
|
#144
Good
39.1%
Slovenes
79.5
/100
|
#145
Good
39.1%
Swedes
79.2
/100
|
#146
Good
39.1%
Immigrants | Sierra Leone
79.0
/100
|
#147
Good
39.0%
Iraqis
78.1
/100
|
#148
Good
39.0%
Immigrants | Poland
77.5
/100
|
#149
Good
39.0%
South Americans
77.3
/100
|
#150
Good
38.9%
Immigrants | Africa
76.5
/100
|
#151
Good
38.9%
Sudanese
76.4
/100
|
#152
Good
38.9%
Slavs
75.9
/100
|
#153
Good
38.9%

Demographics Similar to Belizeans by Bachelor's Degree

In terms of bachelor's degree, the demographic groups most similar to Belizeans are African (32.9%, a difference of 0.29%), Immigrants from Jamaica (32.9%, a difference of 0.29%), Malaysian (32.9%, a difference of 0.38%), Osage (33.0%, a difference of 0.75%), and Central American Indian (32.5%, a difference of 0.78%).
DemographicsRating | RankBachelor's Degree
Nicaraguans
0.6
/100
|
#256
Tragic
33.1%
Spanish Americans
0.6
/100
|
#257
Tragic
33.1%
French American Indians
0.6
/100
|
#258
Tragic
33.1%
Osage
0.5
/100
|
#259
Tragic
33.0%
Malaysians
0.5
/100
|
#260
Tragic
32.9%
Africans
0.5
/100
|
#261
Tragic
32.9%
Immigrants | Jamaica
0.5
/100
|
#262
Tragic
32.9%
Belizeans
0.4
/100
|
#263
Tragic
32.8%
Central American Indians
0.3
/100
|
#264
Tragic
32.5%
Bahamians
0.3
/100
|
#265
Tragic
32.5%
Immigrants | Dominica
0.3
/100
|
#266
Tragic
32.5%
Cubans
0.3
/100
|
#267
Tragic
32.5%
Immigrants | Portugal
0.2
/100
|
#268
Tragic
32.2%
Immigrants | Belize
0.2
/100
|
#269
Tragic
32.1%
Immigrants | Nicaragua
0.2
/100
|
#270
Tragic
31.9%