Sierra Leonean vs Soviet Union 4th Grade
COMPARE
Sierra Leonean
Soviet Union
4th Grade
4th Grade Comparison
Sierra Leoneans
Soviet Union
97.3%
4TH GRADE
6.5/ 100
METRIC RATING
217th/ 347
METRIC RANK
97.6%
4TH GRADE
77.8/ 100
METRIC RATING
149th/ 347
METRIC RANK
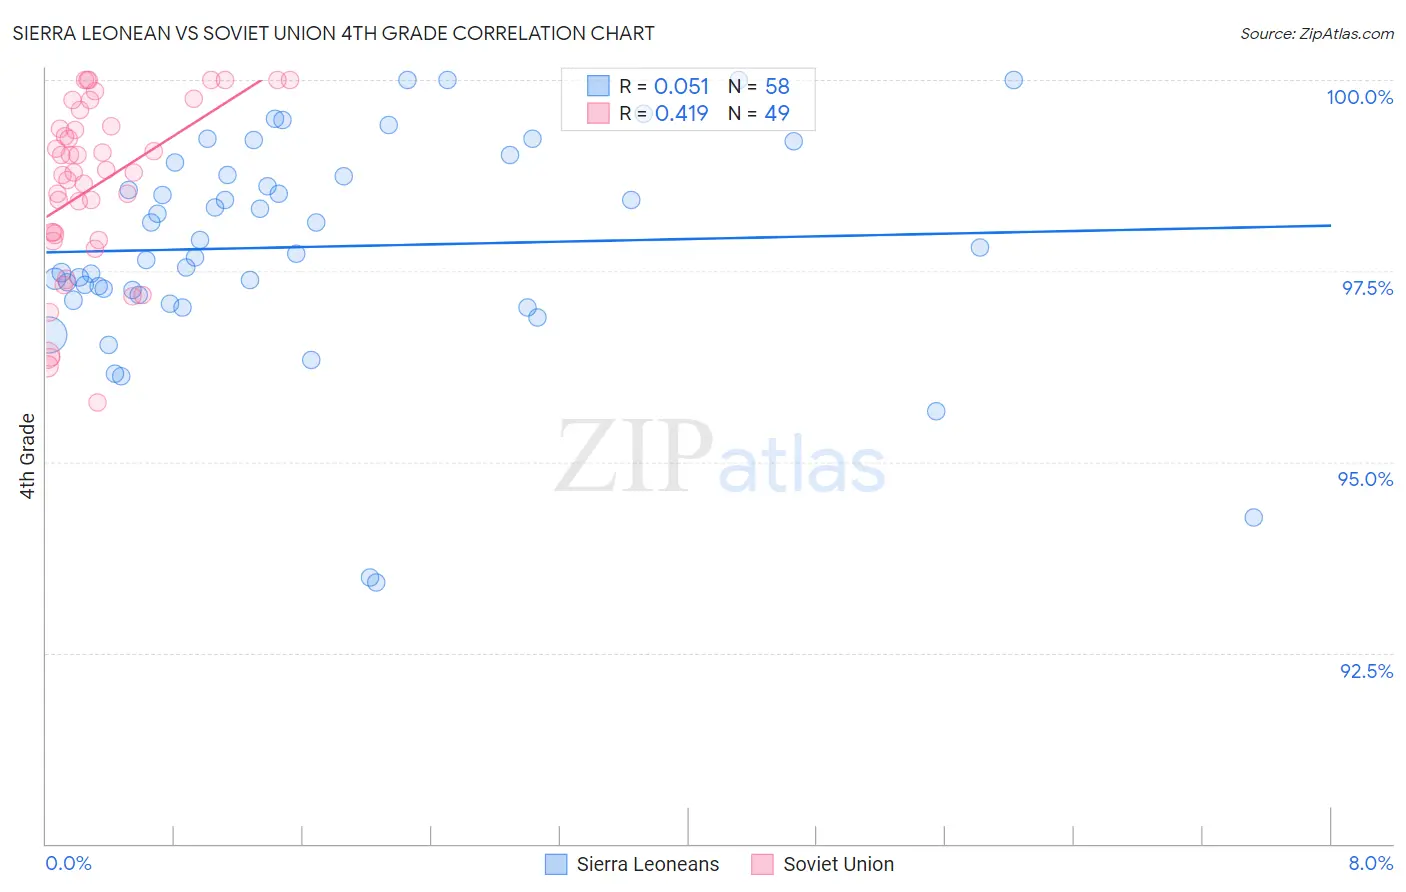
Sierra Leonean vs Soviet Union 4th Grade Correlation Chart
The statistical analysis conducted on geographies consisting of 83,337,655 people shows a slight positive correlation between the proportion of Sierra Leoneans and percentage of population with at least 4th grade education in the United States with a correlation coefficient (R) of 0.051 and weighted average of 97.3%. Similarly, the statistical analysis conducted on geographies consisting of 43,454,395 people shows a moderate positive correlation between the proportion of Soviet Union and percentage of population with at least 4th grade education in the United States with a correlation coefficient (R) of 0.419 and weighted average of 97.6%, a difference of 0.37%.
4th Grade Correlation Summary
| Measurement | Sierra Leonean | Soviet Union |
| Minimum | 93.4% | 95.8% |
| Maximum | 100.0% | 100.0% |
| Range | 6.6% | 4.2% |
| Mean | 97.8% | 98.6% |
| Median | 97.8% | 98.8% |
| Interquartile 25% (IQ1) | 97.2% | 97.9% |
| Interquartile 75% (IQ3) | 98.8% | 99.5% |
| Interquartile Range (IQR) | 1.6% | 1.6% |
| Standard Deviation (Sample) | 1.4% | 1.1% |
| Standard Deviation (Population) | 1.4% | 1.1% |
Similar Demographics by 4th Grade
Demographics Similar to Sierra Leoneans by 4th Grade
In terms of 4th grade, the demographic groups most similar to Sierra Leoneans are Samoan (97.3%, a difference of 0.0%), Iraqi (97.3%, a difference of 0.0%), Immigrants from Morocco (97.3%, a difference of 0.010%), Tongan (97.3%, a difference of 0.010%), and Costa Rican (97.3%, a difference of 0.020%).
| Demographics | Rating | Rank | 4th Grade |
| Immigrants | Oceania | 9.1 /100 | #210 | Tragic 97.3% |
| Sudanese | 9.0 /100 | #211 | Tragic 97.3% |
| Tohono O'odham | 8.4 /100 | #212 | Tragic 97.3% |
| Costa Ricans | 8.3 /100 | #213 | Tragic 97.3% |
| Immigrants | Nepal | 7.7 /100 | #214 | Tragic 97.3% |
| Immigrants | Morocco | 7.1 /100 | #215 | Tragic 97.3% |
| Samoans | 6.8 /100 | #216 | Tragic 97.3% |
| Sierra Leoneans | 6.5 /100 | #217 | Tragic 97.3% |
| Iraqis | 6.3 /100 | #218 | Tragic 97.3% |
| Tongans | 5.8 /100 | #219 | Tragic 97.3% |
| South American Indians | 5.5 /100 | #220 | Tragic 97.3% |
| Immigrants | Panama | 5.4 /100 | #221 | Tragic 97.3% |
| Immigrants | Lebanon | 5.1 /100 | #222 | Tragic 97.3% |
| Immigrants | Sudan | 5.0 /100 | #223 | Tragic 97.2% |
| Immigrants | Syria | 5.0 /100 | #224 | Tragic 97.2% |
Demographics Similar to Soviet Union by 4th Grade
In terms of 4th grade, the demographic groups most similar to Soviet Union are Immigrants from Israel (97.6%, a difference of 0.0%), Alsatian (97.6%, a difference of 0.0%), Immigrants from South Central Asia (97.6%, a difference of 0.010%), Jordanian (97.7%, a difference of 0.020%), and Ute (97.7%, a difference of 0.020%).
| Demographics | Rating | Rank | 4th Grade |
| Immigrants | North Macedonia | 83.3 /100 | #142 | Excellent 97.7% |
| Burmese | 82.8 /100 | #143 | Excellent 97.7% |
| Spaniards | 82.7 /100 | #144 | Excellent 97.7% |
| Immigrants | Moldova | 82.4 /100 | #145 | Excellent 97.7% |
| Jordanians | 81.3 /100 | #146 | Excellent 97.7% |
| Ute | 80.6 /100 | #147 | Excellent 97.7% |
| Hopi | 80.6 /100 | #148 | Excellent 97.7% |
| Soviet Union | 77.8 /100 | #149 | Good 97.6% |
| Immigrants | Israel | 77.7 /100 | #150 | Good 97.6% |
| Alsatians | 77.2 /100 | #151 | Good 97.6% |
| Immigrants | South Central Asia | 76.2 /100 | #152 | Good 97.6% |
| Immigrants | Eastern Europe | 71.3 /100 | #153 | Good 97.6% |
| Immigrants | Russia | 67.0 /100 | #154 | Good 97.6% |
| Albanians | 67.0 /100 | #155 | Good 97.6% |
| Immigrants | Jordan | 66.9 /100 | #156 | Good 97.6% |