Nicaraguan vs Immigrants from Hong Kong 4th Grade
COMPARE
Nicaraguan
Immigrants from Hong Kong
4th Grade
4th Grade Comparison
Nicaraguans
Immigrants from Hong Kong
96.2%
4TH GRADE
0.0/ 100
METRIC RATING
315th/ 347
METRIC RANK
96.9%
4TH GRADE
0.1/ 100
METRIC RATING
281st/ 347
METRIC RANK
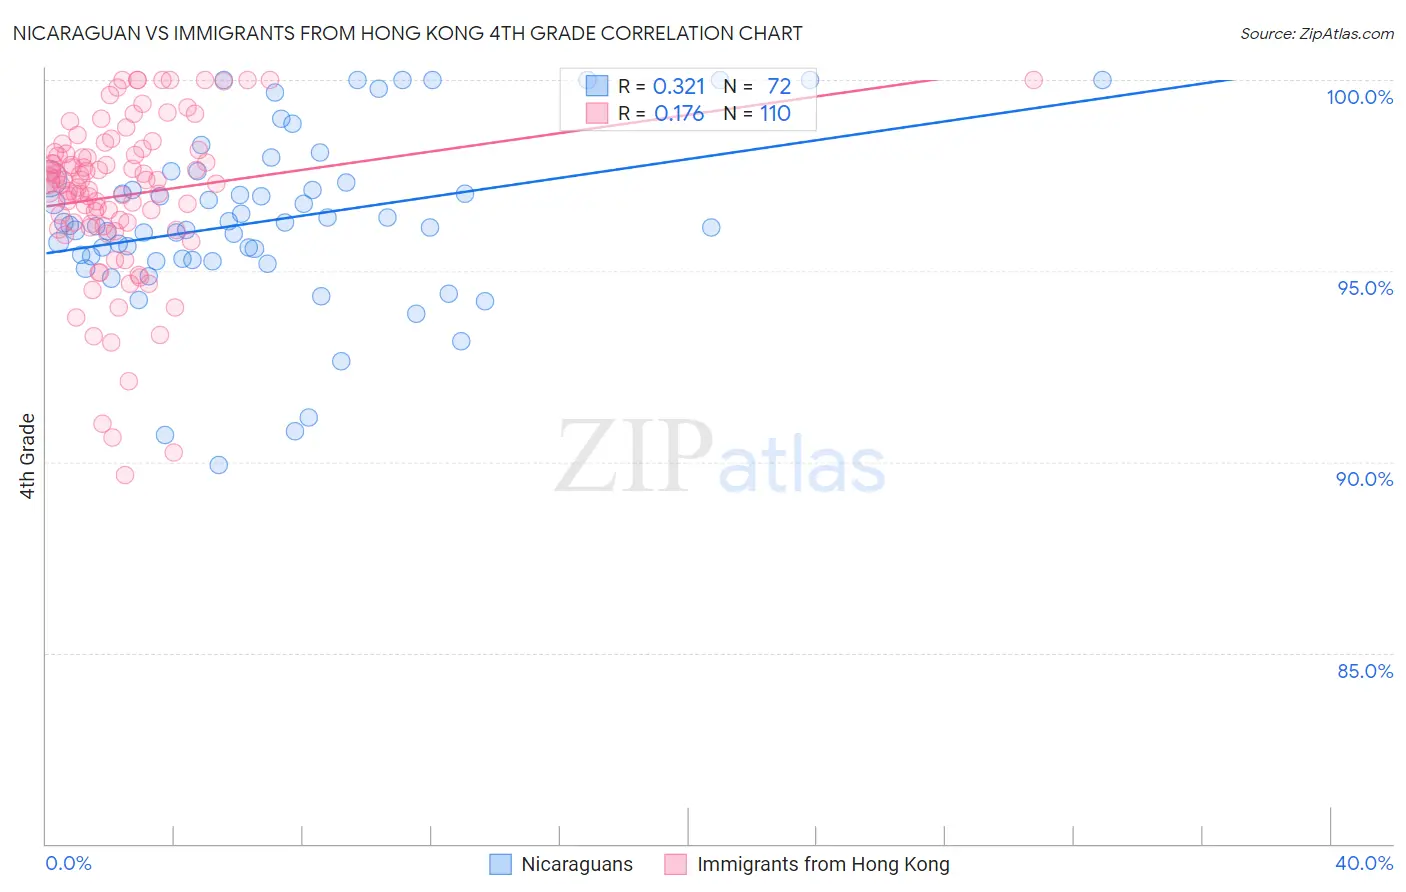
Nicaraguan vs Immigrants from Hong Kong 4th Grade Correlation Chart
The statistical analysis conducted on geographies consisting of 285,711,389 people shows a mild positive correlation between the proportion of Nicaraguans and percentage of population with at least 4th grade education in the United States with a correlation coefficient (R) of 0.321 and weighted average of 96.2%. Similarly, the statistical analysis conducted on geographies consisting of 253,948,669 people shows a poor positive correlation between the proportion of Immigrants from Hong Kong and percentage of population with at least 4th grade education in the United States with a correlation coefficient (R) of 0.176 and weighted average of 96.9%, a difference of 0.66%.
4th Grade Correlation Summary
| Measurement | Nicaraguan | Immigrants from Hong Kong |
| Minimum | 89.9% | 89.7% |
| Maximum | 100.0% | 100.0% |
| Range | 10.1% | 10.3% |
| Mean | 96.3% | 97.0% |
| Median | 96.2% | 97.3% |
| Interquartile 25% (IQ1) | 95.3% | 96.2% |
| Interquartile 75% (IQ3) | 97.4% | 98.1% |
| Interquartile Range (IQR) | 2.0% | 1.9% |
| Standard Deviation (Sample) | 2.2% | 2.1% |
| Standard Deviation (Population) | 2.2% | 2.1% |
Similar Demographics by 4th Grade
Demographics Similar to Nicaraguans by 4th Grade
In terms of 4th grade, the demographic groups most similar to Nicaraguans are Indonesian (96.2%, a difference of 0.010%), Vietnamese (96.2%, a difference of 0.010%), Immigrants from Ecuador (96.2%, a difference of 0.010%), Immigrants from Bangladesh (96.2%, a difference of 0.030%), and Cape Verdean (96.2%, a difference of 0.030%).
| Demographics | Rating | Rank | 4th Grade |
| Immigrants | Laos | 0.0 /100 | #308 | Tragic 96.3% |
| Immigrants | Guyana | 0.0 /100 | #309 | Tragic 96.3% |
| Immigrants | Burma/Myanmar | 0.0 /100 | #310 | Tragic 96.3% |
| Immigrants | Bangladesh | 0.0 /100 | #311 | Tragic 96.2% |
| Cape Verdeans | 0.0 /100 | #312 | Tragic 96.2% |
| Indonesians | 0.0 /100 | #313 | Tragic 96.2% |
| Vietnamese | 0.0 /100 | #314 | Tragic 96.2% |
| Nicaraguans | 0.0 /100 | #315 | Tragic 96.2% |
| Immigrants | Ecuador | 0.0 /100 | #316 | Tragic 96.2% |
| Central American Indians | 0.0 /100 | #317 | Tragic 96.2% |
| Immigrants | Azores | 0.0 /100 | #318 | Tragic 96.1% |
| Belizeans | 0.0 /100 | #319 | Tragic 96.1% |
| Bangladeshis | 0.0 /100 | #320 | Tragic 96.1% |
| Japanese | 0.0 /100 | #321 | Tragic 96.0% |
| Immigrants | Vietnam | 0.0 /100 | #322 | Tragic 96.0% |
Demographics Similar to Immigrants from Hong Kong by 4th Grade
In terms of 4th grade, the demographic groups most similar to Immigrants from Hong Kong are Immigrants from Trinidad and Tobago (96.8%, a difference of 0.0%), Immigrants from Philippines (96.8%, a difference of 0.0%), Barbadian (96.9%, a difference of 0.010%), Afghan (96.9%, a difference of 0.020%), and Immigrants from St. Vincent and the Grenadines (96.8%, a difference of 0.020%).
| Demographics | Rating | Rank | 4th Grade |
| Trinidadians and Tobagonians | 0.1 /100 | #274 | Tragic 96.9% |
| Immigrants | Ghana | 0.1 /100 | #275 | Tragic 96.9% |
| Yaqui | 0.1 /100 | #276 | Tragic 96.9% |
| Immigrants | Western Africa | 0.1 /100 | #277 | Tragic 96.9% |
| Immigrants | Bolivia | 0.1 /100 | #278 | Tragic 96.9% |
| Afghans | 0.1 /100 | #279 | Tragic 96.9% |
| Barbadians | 0.1 /100 | #280 | Tragic 96.9% |
| Immigrants | Hong Kong | 0.1 /100 | #281 | Tragic 96.9% |
| Immigrants | Trinidad and Tobago | 0.1 /100 | #282 | Tragic 96.8% |
| Immigrants | Philippines | 0.1 /100 | #283 | Tragic 96.8% |
| Immigrants | St. Vincent and the Grenadines | 0.1 /100 | #284 | Tragic 96.8% |
| Immigrants | Barbados | 0.0 /100 | #285 | Tragic 96.8% |
| Immigrants | Thailand | 0.0 /100 | #286 | Tragic 96.8% |
| Houma | 0.0 /100 | #287 | Tragic 96.8% |
| Immigrants | Afghanistan | 0.0 /100 | #288 | Tragic 96.8% |