Nepalese vs Okinawan 7th Grade
COMPARE
Nepalese
Okinawan
7th Grade
7th Grade Comparison
Nepalese
Okinawans
93.2%
7TH GRADE
0.0/ 100
METRIC RATING
326th/ 347
METRIC RANK
96.6%
7TH GRADE
97.4/ 100
METRIC RATING
110th/ 347
METRIC RANK
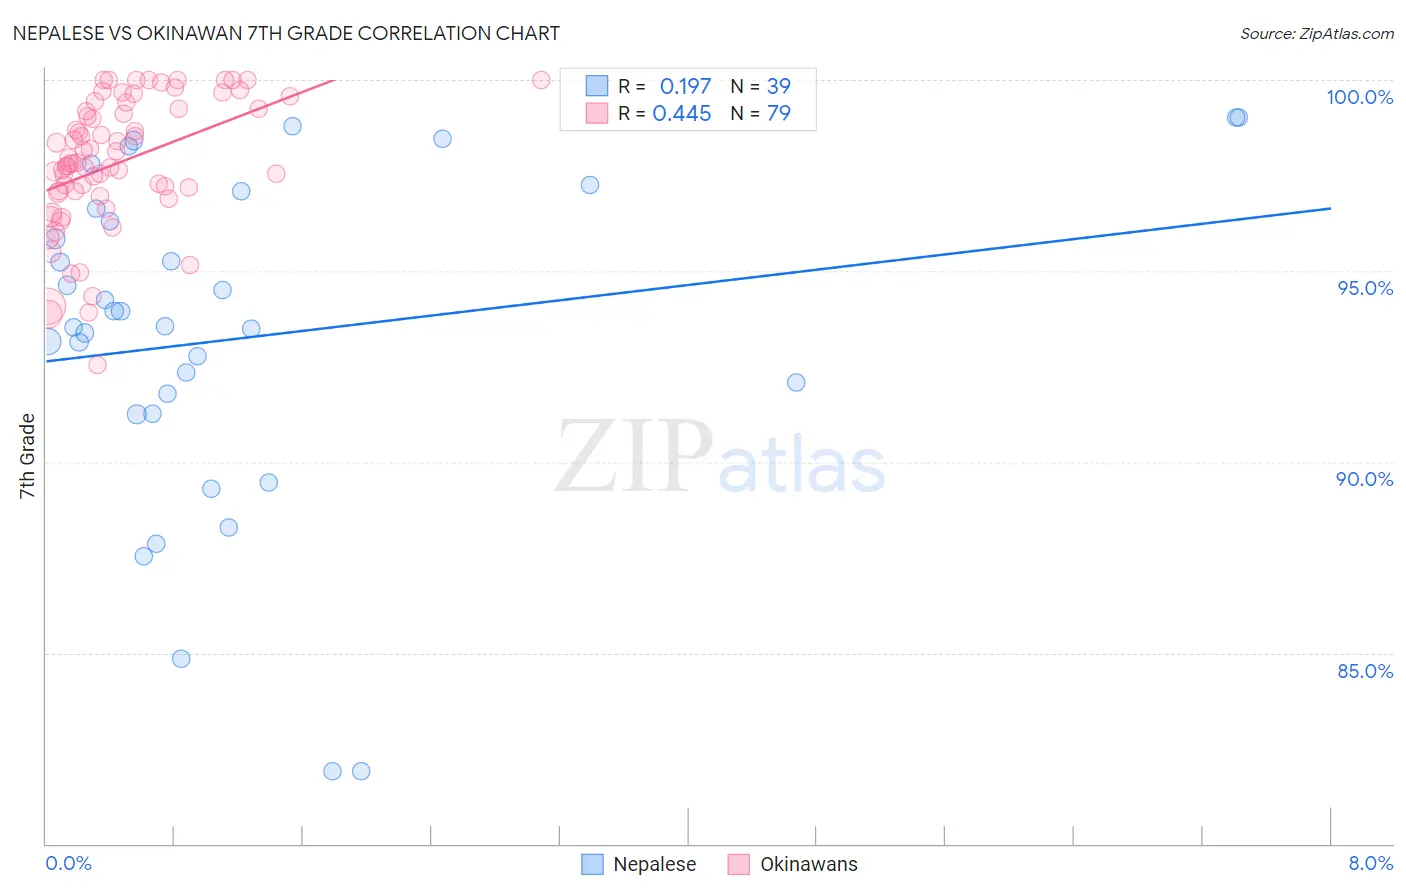
Nepalese vs Okinawan 7th Grade Correlation Chart
The statistical analysis conducted on geographies consisting of 24,519,269 people shows a poor positive correlation between the proportion of Nepalese and percentage of population with at least 7th grade education in the United States with a correlation coefficient (R) of 0.197 and weighted average of 93.2%. Similarly, the statistical analysis conducted on geographies consisting of 73,779,368 people shows a moderate positive correlation between the proportion of Okinawans and percentage of population with at least 7th grade education in the United States with a correlation coefficient (R) of 0.445 and weighted average of 96.6%, a difference of 3.6%.
7th Grade Correlation Summary
| Measurement | Nepalese | Okinawan |
| Minimum | 81.9% | 92.6% |
| Maximum | 99.0% | 100.0% |
| Range | 17.1% | 7.4% |
| Mean | 93.3% | 97.8% |
| Median | 93.6% | 97.8% |
| Interquartile 25% (IQ1) | 91.3% | 97.0% |
| Interquartile 75% (IQ3) | 96.6% | 99.2% |
| Interquartile Range (IQR) | 5.4% | 2.2% |
| Standard Deviation (Sample) | 4.4% | 1.7% |
| Standard Deviation (Population) | 4.3% | 1.7% |
Similar Demographics by 7th Grade
Demographics Similar to Nepalese by 7th Grade
In terms of 7th grade, the demographic groups most similar to Nepalese are Immigrants from Cabo Verde (93.1%, a difference of 0.070%), Central American Indian (93.3%, a difference of 0.11%), Dominican (93.3%, a difference of 0.18%), Immigrants from Belize (93.4%, a difference of 0.19%), and Immigrants from Nicaragua (93.0%, a difference of 0.20%).
| Demographics | Rating | Rank | 7th Grade |
| Immigrants | Cambodia | 0.0 /100 | #319 | Tragic 93.7% |
| Immigrants | Fiji | 0.0 /100 | #320 | Tragic 93.5% |
| Belizeans | 0.0 /100 | #321 | Tragic 93.5% |
| Nicaraguans | 0.0 /100 | #322 | Tragic 93.5% |
| Immigrants | Belize | 0.0 /100 | #323 | Tragic 93.4% |
| Dominicans | 0.0 /100 | #324 | Tragic 93.3% |
| Central American Indians | 0.0 /100 | #325 | Tragic 93.3% |
| Nepalese | 0.0 /100 | #326 | Tragic 93.2% |
| Immigrants | Cabo Verde | 0.0 /100 | #327 | Tragic 93.1% |
| Immigrants | Nicaragua | 0.0 /100 | #328 | Tragic 93.0% |
| Immigrants | Azores | 0.0 /100 | #329 | Tragic 93.0% |
| Immigrants | Dominican Republic | 0.0 /100 | #330 | Tragic 92.9% |
| Hondurans | 0.0 /100 | #331 | Tragic 92.9% |
| Hispanics or Latinos | 0.0 /100 | #332 | Tragic 92.7% |
| Immigrants | Armenia | 0.0 /100 | #333 | Tragic 92.7% |
Demographics Similar to Okinawans by 7th Grade
In terms of 7th grade, the demographic groups most similar to Okinawans are Immigrants from Latvia (96.6%, a difference of 0.0%), Lumbee (96.6%, a difference of 0.020%), Immigrants from Saudi Arabia (96.6%, a difference of 0.020%), Bhutanese (96.6%, a difference of 0.020%), and Nonimmigrants (96.5%, a difference of 0.020%).
| Demographics | Rating | Rank | 7th Grade |
| Immigrants | Singapore | 98.3 /100 | #103 | Exceptional 96.6% |
| Shoshone | 98.1 /100 | #104 | Exceptional 96.6% |
| South Africans | 98.0 /100 | #105 | Exceptional 96.6% |
| Iroquois | 97.9 /100 | #106 | Exceptional 96.6% |
| Lumbee | 97.8 /100 | #107 | Exceptional 96.6% |
| Immigrants | Saudi Arabia | 97.8 /100 | #108 | Exceptional 96.6% |
| Bhutanese | 97.7 /100 | #109 | Exceptional 96.6% |
| Okinawans | 97.4 /100 | #110 | Exceptional 96.6% |
| Immigrants | Latvia | 97.4 /100 | #111 | Exceptional 96.6% |
| Immigrants | Nonimmigrants | 97.0 /100 | #112 | Exceptional 96.5% |
| Pueblo | 96.8 /100 | #113 | Exceptional 96.5% |
| Immigrants | Zimbabwe | 96.6 /100 | #114 | Exceptional 96.5% |
| Choctaw | 96.6 /100 | #115 | Exceptional 96.5% |
| Syrians | 96.6 /100 | #116 | Exceptional 96.5% |
| Immigrants | Moldova | 95.7 /100 | #117 | Exceptional 96.5% |