Nepalese vs Immigrants from Trinidad and Tobago 4th Grade
COMPARE
Nepalese
Immigrants from Trinidad and Tobago
4th Grade
4th Grade Comparison
Nepalese
Immigrants from Trinidad and Tobago
95.5%
4TH GRADE
0.0/ 100
METRIC RATING
338th/ 347
METRIC RANK
96.8%
4TH GRADE
0.1/ 100
METRIC RATING
282nd/ 347
METRIC RANK
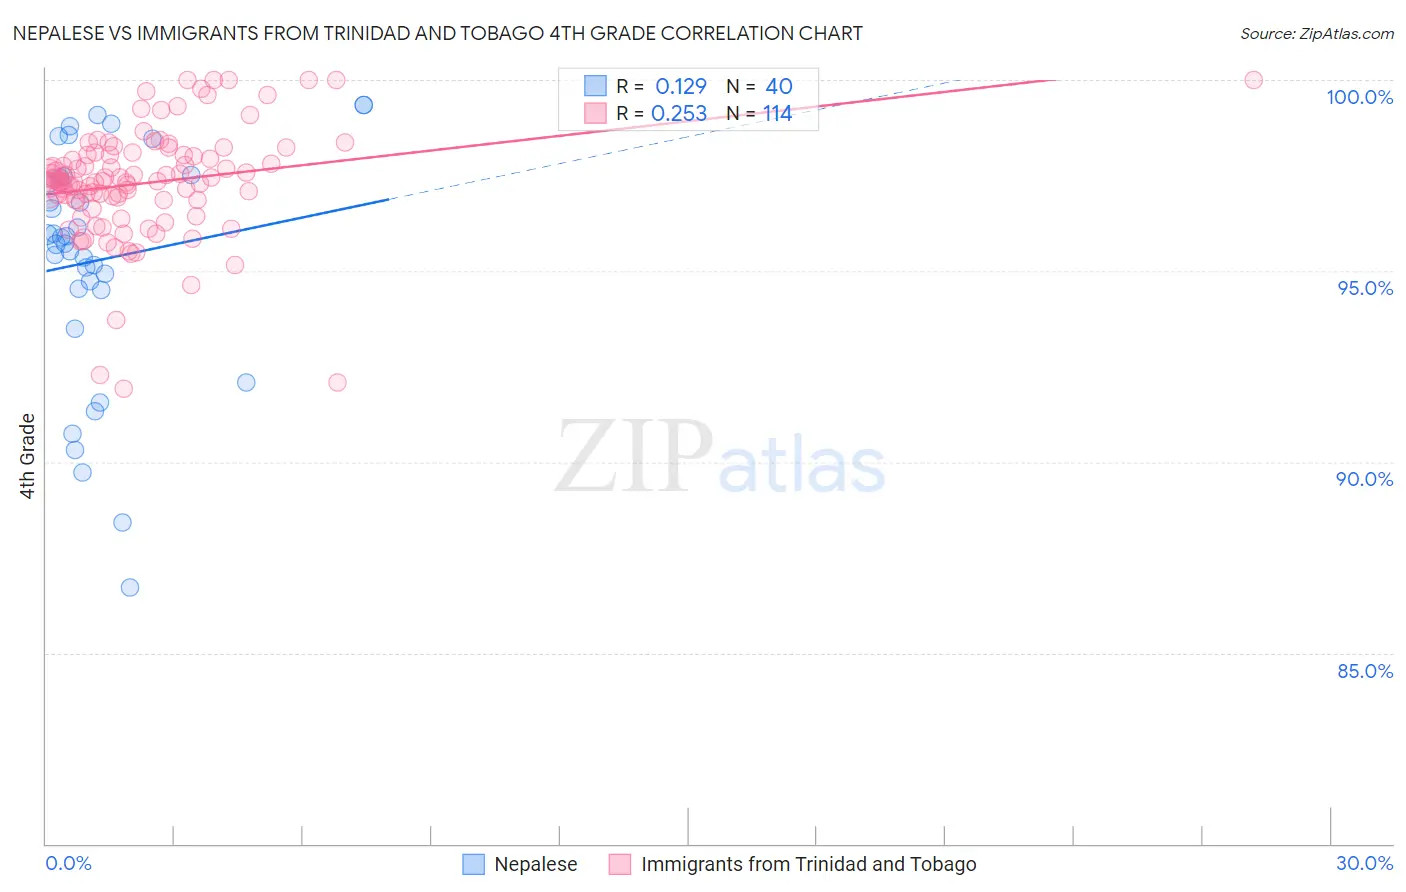
Nepalese vs Immigrants from Trinidad and Tobago 4th Grade Correlation Chart
The statistical analysis conducted on geographies consisting of 24,521,755 people shows a poor positive correlation between the proportion of Nepalese and percentage of population with at least 4th grade education in the United States with a correlation coefficient (R) of 0.129 and weighted average of 95.5%. Similarly, the statistical analysis conducted on geographies consisting of 223,526,834 people shows a weak positive correlation between the proportion of Immigrants from Trinidad and Tobago and percentage of population with at least 4th grade education in the United States with a correlation coefficient (R) of 0.253 and weighted average of 96.8%, a difference of 1.4%.
4th Grade Correlation Summary
| Measurement | Nepalese | Immigrants from Trinidad and Tobago |
| Minimum | 86.7% | 91.9% |
| Maximum | 99.3% | 100.0% |
| Range | 12.6% | 8.1% |
| Mean | 95.3% | 97.3% |
| Median | 95.8% | 97.3% |
| Interquartile 25% (IQ1) | 94.5% | 96.9% |
| Interquartile 75% (IQ3) | 97.5% | 98.1% |
| Interquartile Range (IQR) | 2.9% | 1.2% |
| Standard Deviation (Sample) | 3.1% | 1.5% |
| Standard Deviation (Population) | 3.1% | 1.5% |
Similar Demographics by 4th Grade
Demographics Similar to Nepalese by 4th Grade
In terms of 4th grade, the demographic groups most similar to Nepalese are Central American (95.5%, a difference of 0.0%), Mexican (95.6%, a difference of 0.13%), Immigrants from Latin America (95.7%, a difference of 0.20%), Guatemalan (95.3%, a difference of 0.20%), and Immigrants from Dominican Republic (95.7%, a difference of 0.26%).
| Demographics | Rating | Rank | 4th Grade |
| Immigrants | Armenia | 0.0 /100 | #331 | Tragic 95.8% |
| Immigrants | Honduras | 0.0 /100 | #332 | Tragic 95.8% |
| Immigrants | Dominican Republic | 0.0 /100 | #333 | Tragic 95.7% |
| Immigrants | Cabo Verde | 0.0 /100 | #334 | Tragic 95.7% |
| Immigrants | Latin America | 0.0 /100 | #335 | Tragic 95.7% |
| Mexicans | 0.0 /100 | #336 | Tragic 95.6% |
| Central Americans | 0.0 /100 | #337 | Tragic 95.5% |
| Nepalese | 0.0 /100 | #338 | Tragic 95.5% |
| Guatemalans | 0.0 /100 | #339 | Tragic 95.3% |
| Yakama | 0.0 /100 | #340 | Tragic 95.2% |
| Immigrants | Yemen | 0.0 /100 | #341 | Tragic 95.2% |
| Immigrants | Central America | 0.0 /100 | #342 | Tragic 95.1% |
| Immigrants | Guatemala | 0.0 /100 | #343 | Tragic 95.1% |
| Immigrants | Mexico | 0.0 /100 | #344 | Tragic 95.1% |
| Salvadorans | 0.0 /100 | #345 | Tragic 95.0% |
Demographics Similar to Immigrants from Trinidad and Tobago by 4th Grade
In terms of 4th grade, the demographic groups most similar to Immigrants from Trinidad and Tobago are Immigrants from Hong Kong (96.9%, a difference of 0.0%), Immigrants from Philippines (96.8%, a difference of 0.0%), Barbadian (96.9%, a difference of 0.020%), Immigrants from St. Vincent and the Grenadines (96.8%, a difference of 0.020%), and Immigrants from Western Africa (96.9%, a difference of 0.030%).
| Demographics | Rating | Rank | 4th Grade |
| Immigrants | Ghana | 0.1 /100 | #275 | Tragic 96.9% |
| Yaqui | 0.1 /100 | #276 | Tragic 96.9% |
| Immigrants | Western Africa | 0.1 /100 | #277 | Tragic 96.9% |
| Immigrants | Bolivia | 0.1 /100 | #278 | Tragic 96.9% |
| Afghans | 0.1 /100 | #279 | Tragic 96.9% |
| Barbadians | 0.1 /100 | #280 | Tragic 96.9% |
| Immigrants | Hong Kong | 0.1 /100 | #281 | Tragic 96.9% |
| Immigrants | Trinidad and Tobago | 0.1 /100 | #282 | Tragic 96.8% |
| Immigrants | Philippines | 0.1 /100 | #283 | Tragic 96.8% |
| Immigrants | St. Vincent and the Grenadines | 0.1 /100 | #284 | Tragic 96.8% |
| Immigrants | Barbados | 0.0 /100 | #285 | Tragic 96.8% |
| Immigrants | Thailand | 0.0 /100 | #286 | Tragic 96.8% |
| Houma | 0.0 /100 | #287 | Tragic 96.8% |
| Immigrants | Afghanistan | 0.0 /100 | #288 | Tragic 96.8% |
| Immigrants | West Indies | 0.0 /100 | #289 | Tragic 96.7% |