Nepalese vs Immigrants from Uruguay 4th Grade
COMPARE
Nepalese
Immigrants from Uruguay
4th Grade
4th Grade Comparison
Nepalese
Immigrants from Uruguay
95.5%
4TH GRADE
0.0/ 100
METRIC RATING
338th/ 347
METRIC RANK
97.1%
4TH GRADE
1.2/ 100
METRIC RATING
246th/ 347
METRIC RANK
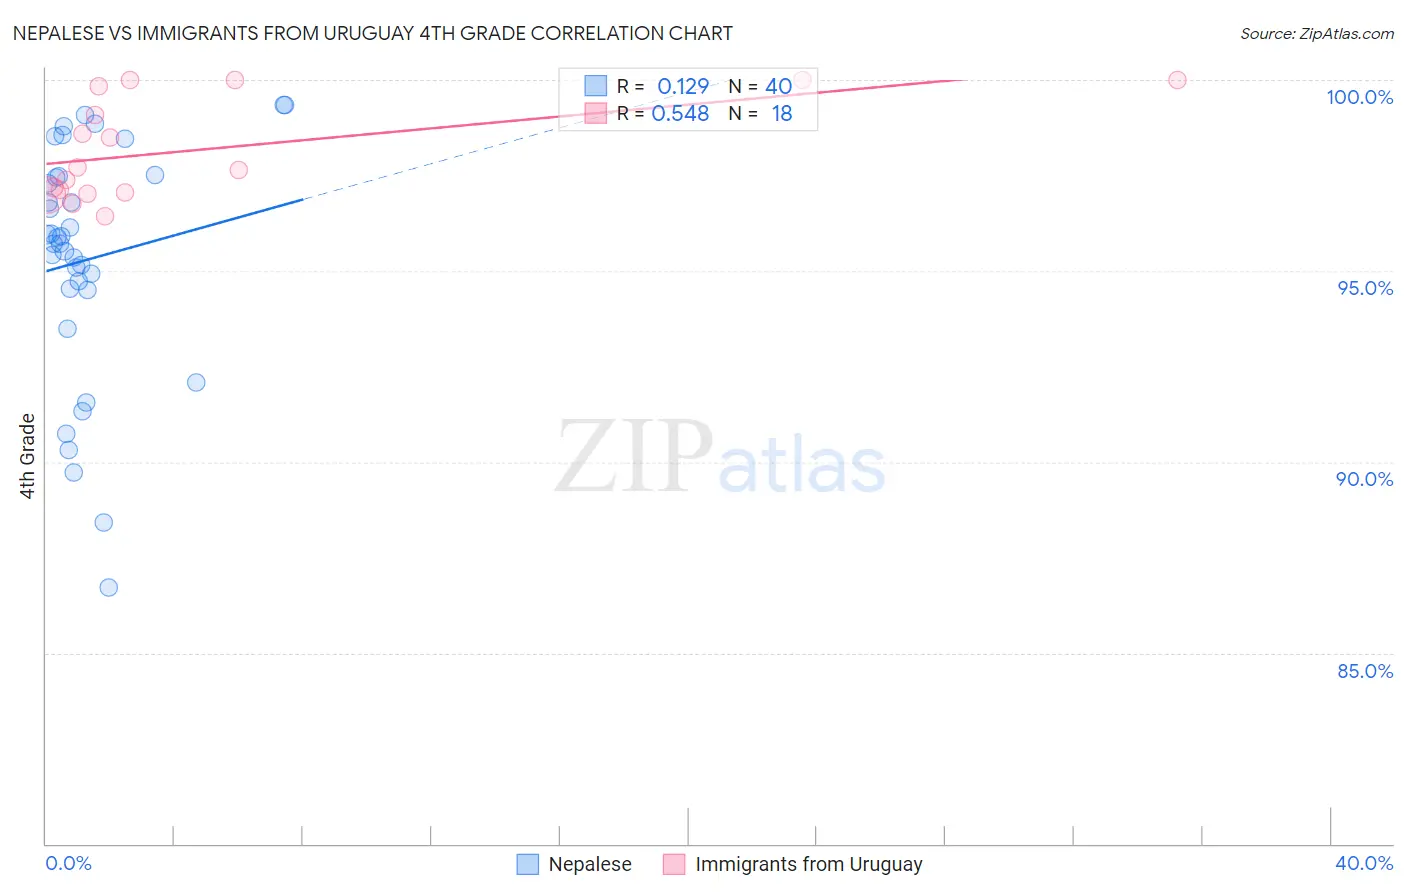
Nepalese vs Immigrants from Uruguay 4th Grade Correlation Chart
The statistical analysis conducted on geographies consisting of 24,521,755 people shows a poor positive correlation between the proportion of Nepalese and percentage of population with at least 4th grade education in the United States with a correlation coefficient (R) of 0.129 and weighted average of 95.5%. Similarly, the statistical analysis conducted on geographies consisting of 133,259,667 people shows a substantial positive correlation between the proportion of Immigrants from Uruguay and percentage of population with at least 4th grade education in the United States with a correlation coefficient (R) of 0.548 and weighted average of 97.1%, a difference of 1.7%.
4th Grade Correlation Summary
| Measurement | Nepalese | Immigrants from Uruguay |
| Minimum | 86.7% | 96.4% |
| Maximum | 99.3% | 100.0% |
| Range | 12.6% | 3.6% |
| Mean | 95.3% | 98.2% |
| Median | 95.8% | 97.7% |
| Interquartile 25% (IQ1) | 94.5% | 97.1% |
| Interquartile 75% (IQ3) | 97.5% | 99.8% |
| Interquartile Range (IQR) | 2.9% | 2.8% |
| Standard Deviation (Sample) | 3.1% | 1.3% |
| Standard Deviation (Population) | 3.1% | 1.3% |
Similar Demographics by 4th Grade
Demographics Similar to Nepalese by 4th Grade
In terms of 4th grade, the demographic groups most similar to Nepalese are Central American (95.5%, a difference of 0.0%), Mexican (95.6%, a difference of 0.13%), Immigrants from Latin America (95.7%, a difference of 0.20%), Guatemalan (95.3%, a difference of 0.20%), and Immigrants from Dominican Republic (95.7%, a difference of 0.26%).
| Demographics | Rating | Rank | 4th Grade |
| Immigrants | Armenia | 0.0 /100 | #331 | Tragic 95.8% |
| Immigrants | Honduras | 0.0 /100 | #332 | Tragic 95.8% |
| Immigrants | Dominican Republic | 0.0 /100 | #333 | Tragic 95.7% |
| Immigrants | Cabo Verde | 0.0 /100 | #334 | Tragic 95.7% |
| Immigrants | Latin America | 0.0 /100 | #335 | Tragic 95.7% |
| Mexicans | 0.0 /100 | #336 | Tragic 95.6% |
| Central Americans | 0.0 /100 | #337 | Tragic 95.5% |
| Nepalese | 0.0 /100 | #338 | Tragic 95.5% |
| Guatemalans | 0.0 /100 | #339 | Tragic 95.3% |
| Yakama | 0.0 /100 | #340 | Tragic 95.2% |
| Immigrants | Yemen | 0.0 /100 | #341 | Tragic 95.2% |
| Immigrants | Central America | 0.0 /100 | #342 | Tragic 95.1% |
| Immigrants | Guatemala | 0.0 /100 | #343 | Tragic 95.1% |
| Immigrants | Mexico | 0.0 /100 | #344 | Tragic 95.1% |
| Salvadorans | 0.0 /100 | #345 | Tragic 95.0% |
Demographics Similar to Immigrants from Uruguay by 4th Grade
In terms of 4th grade, the demographic groups most similar to Immigrants from Uruguay are Korean (97.1%, a difference of 0.0%), Immigrants from Eastern Africa (97.1%, a difference of 0.0%), Ethiopian (97.1%, a difference of 0.0%), Immigrants from Asia (97.1%, a difference of 0.0%), and Asian (97.1%, a difference of 0.010%).
| Demographics | Rating | Rank | 4th Grade |
| Nigerians | 1.8 /100 | #239 | Tragic 97.1% |
| Colombians | 1.6 /100 | #240 | Tragic 97.1% |
| Immigrants | Indonesia | 1.5 /100 | #241 | Tragic 97.1% |
| Asians | 1.4 /100 | #242 | Tragic 97.1% |
| U.S. Virgin Islanders | 1.4 /100 | #243 | Tragic 97.1% |
| Koreans | 1.3 /100 | #244 | Tragic 97.1% |
| Immigrants | Eastern Africa | 1.2 /100 | #245 | Tragic 97.1% |
| Immigrants | Uruguay | 1.2 /100 | #246 | Tragic 97.1% |
| Ethiopians | 1.2 /100 | #247 | Tragic 97.1% |
| Immigrants | Asia | 1.2 /100 | #248 | Tragic 97.1% |
| Immigrants | Africa | 1.0 /100 | #249 | Tragic 97.1% |
| Immigrants | Senegal | 0.9 /100 | #250 | Tragic 97.1% |
| South Americans | 0.8 /100 | #251 | Tragic 97.1% |
| Jamaicans | 0.8 /100 | #252 | Tragic 97.1% |
| Immigrants | Liberia | 0.8 /100 | #253 | Tragic 97.1% |