Spanish American vs Immigrants from Nigeria 4th Grade
COMPARE
Spanish American
Immigrants from Nigeria
4th Grade
4th Grade Comparison
Spanish Americans
Immigrants from Nigeria
97.5%
4TH GRADE
39.3/ 100
METRIC RATING
182nd/ 347
METRIC RANK
97.0%
4TH GRADE
0.3/ 100
METRIC RATING
267th/ 347
METRIC RANK
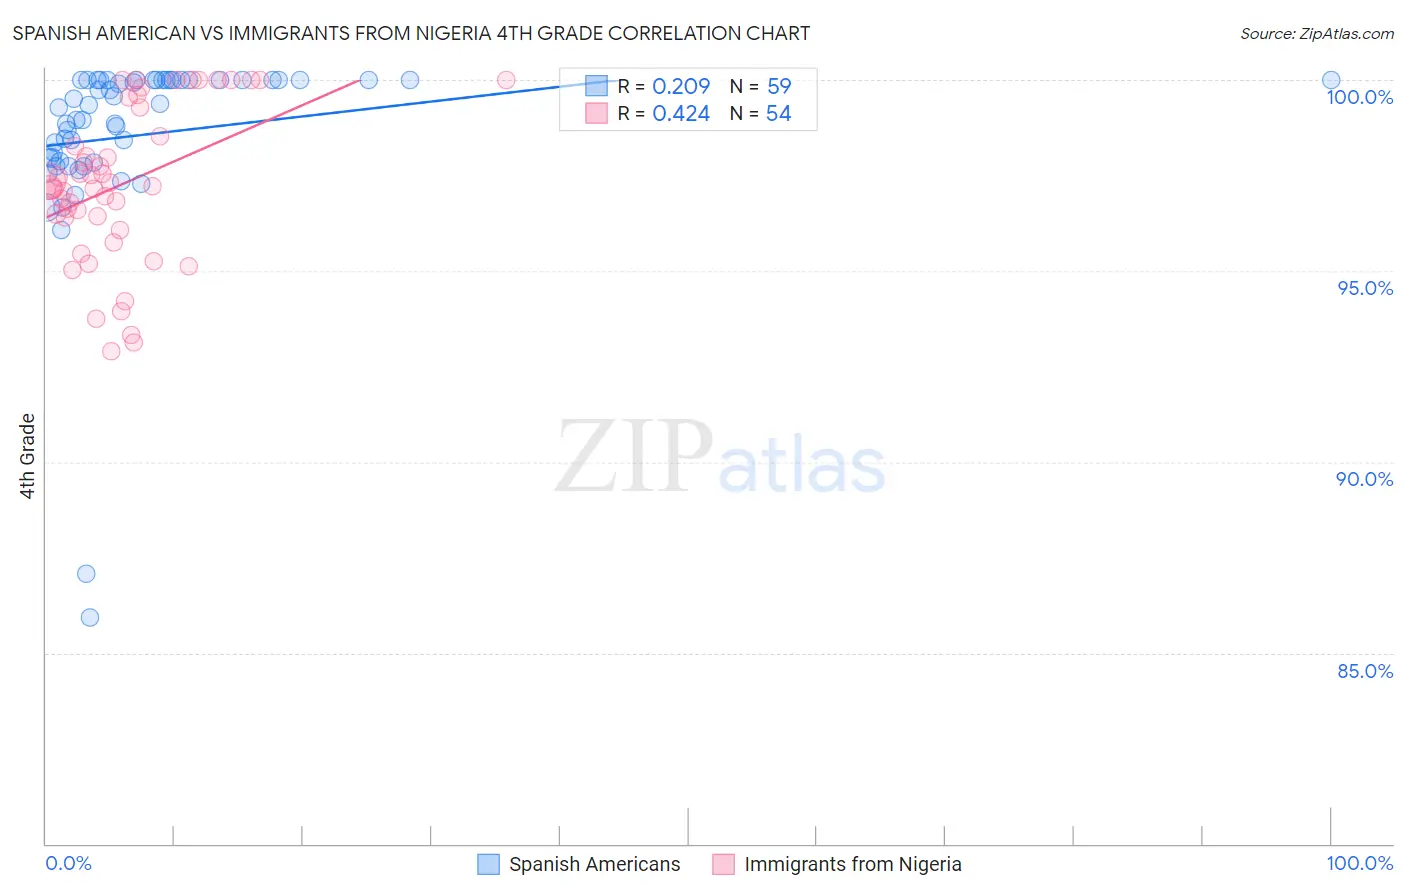
Spanish American vs Immigrants from Nigeria 4th Grade Correlation Chart
The statistical analysis conducted on geographies consisting of 103,168,542 people shows a weak positive correlation between the proportion of Spanish Americans and percentage of population with at least 4th grade education in the United States with a correlation coefficient (R) of 0.209 and weighted average of 97.5%. Similarly, the statistical analysis conducted on geographies consisting of 283,430,369 people shows a moderate positive correlation between the proportion of Immigrants from Nigeria and percentage of population with at least 4th grade education in the United States with a correlation coefficient (R) of 0.424 and weighted average of 97.0%, a difference of 0.52%.
4th Grade Correlation Summary
| Measurement | Spanish American | Immigrants from Nigeria |
| Minimum | 85.9% | 92.9% |
| Maximum | 100.0% | 100.0% |
| Range | 14.1% | 7.1% |
| Mean | 98.6% | 97.3% |
| Median | 99.3% | 97.2% |
| Interquartile 25% (IQ1) | 97.9% | 96.4% |
| Interquartile 75% (IQ3) | 100.0% | 99.3% |
| Interquartile Range (IQR) | 2.1% | 2.9% |
| Standard Deviation (Sample) | 2.5% | 2.0% |
| Standard Deviation (Population) | 2.5% | 2.0% |
Similar Demographics by 4th Grade
Demographics Similar to Spanish Americans by 4th Grade
In terms of 4th grade, the demographic groups most similar to Spanish Americans are Argentinean (97.5%, a difference of 0.0%), Immigrants from Venezuela (97.5%, a difference of 0.010%), Immigrants from Taiwan (97.5%, a difference of 0.010%), Pakistani (97.5%, a difference of 0.010%), and Immigrants from Kenya (97.5%, a difference of 0.010%).
| Demographics | Rating | Rank | 4th Grade |
| Immigrants | Micronesia | 49.6 /100 | #175 | Average 97.5% |
| Arabs | 48.7 /100 | #176 | Average 97.5% |
| Immigrants | Brazil | 46.1 /100 | #177 | Average 97.5% |
| Comanche | 45.3 /100 | #178 | Average 97.5% |
| Immigrants | Kazakhstan | 43.6 /100 | #179 | Average 97.5% |
| Immigrants | Venezuela | 42.7 /100 | #180 | Average 97.5% |
| Immigrants | Taiwan | 41.5 /100 | #181 | Average 97.5% |
| Spanish Americans | 39.3 /100 | #182 | Fair 97.5% |
| Argentineans | 39.0 /100 | #183 | Fair 97.5% |
| Pakistanis | 36.2 /100 | #184 | Fair 97.5% |
| Immigrants | Kenya | 35.8 /100 | #185 | Fair 97.5% |
| Dutch West Indians | 35.8 /100 | #186 | Fair 97.5% |
| Mongolians | 34.7 /100 | #187 | Fair 97.5% |
| Immigrants | Argentina | 34.6 /100 | #188 | Fair 97.5% |
| Panamanians | 31.9 /100 | #189 | Fair 97.4% |
Demographics Similar to Immigrants from Nigeria by 4th Grade
In terms of 4th grade, the demographic groups most similar to Immigrants from Nigeria are Immigrants from China (97.0%, a difference of 0.0%), Taiwanese (97.0%, a difference of 0.010%), Armenian (97.0%, a difference of 0.010%), Ghanaian (97.0%, a difference of 0.010%), and Immigrants from Jamaica (97.0%, a difference of 0.020%).
| Demographics | Rating | Rank | 4th Grade |
| Immigrants | Sierra Leone | 0.4 /100 | #260 | Tragic 97.0% |
| Immigrants | South America | 0.4 /100 | #261 | Tragic 97.0% |
| West Indians | 0.4 /100 | #262 | Tragic 97.0% |
| Immigrants | Jamaica | 0.3 /100 | #263 | Tragic 97.0% |
| Taiwanese | 0.3 /100 | #264 | Tragic 97.0% |
| Armenians | 0.3 /100 | #265 | Tragic 97.0% |
| Immigrants | China | 0.3 /100 | #266 | Tragic 97.0% |
| Immigrants | Nigeria | 0.3 /100 | #267 | Tragic 97.0% |
| Ghanaians | 0.2 /100 | #268 | Tragic 97.0% |
| Immigrants | Uzbekistan | 0.2 /100 | #269 | Tragic 96.9% |
| Cubans | 0.2 /100 | #270 | Tragic 96.9% |
| Immigrants | Peru | 0.1 /100 | #271 | Tragic 96.9% |
| Fijians | 0.1 /100 | #272 | Tragic 96.9% |
| Immigrants | Cameroon | 0.1 /100 | #273 | Tragic 96.9% |
| Trinidadians and Tobagonians | 0.1 /100 | #274 | Tragic 96.9% |