Nepalese vs Icelander Disability Age 18 to 34
COMPARE
Nepalese
Icelander
Disability Age 18 to 34
Disability Age 18 to 34 Comparison
Nepalese
Icelanders
7.1%
DISABILITY AGE 18 TO 34
1.1/ 100
METRIC RATING
241st/ 347
METRIC RANK
7.1%
DISABILITY AGE 18 TO 34
1.0/ 100
METRIC RATING
243rd/ 347
METRIC RANK
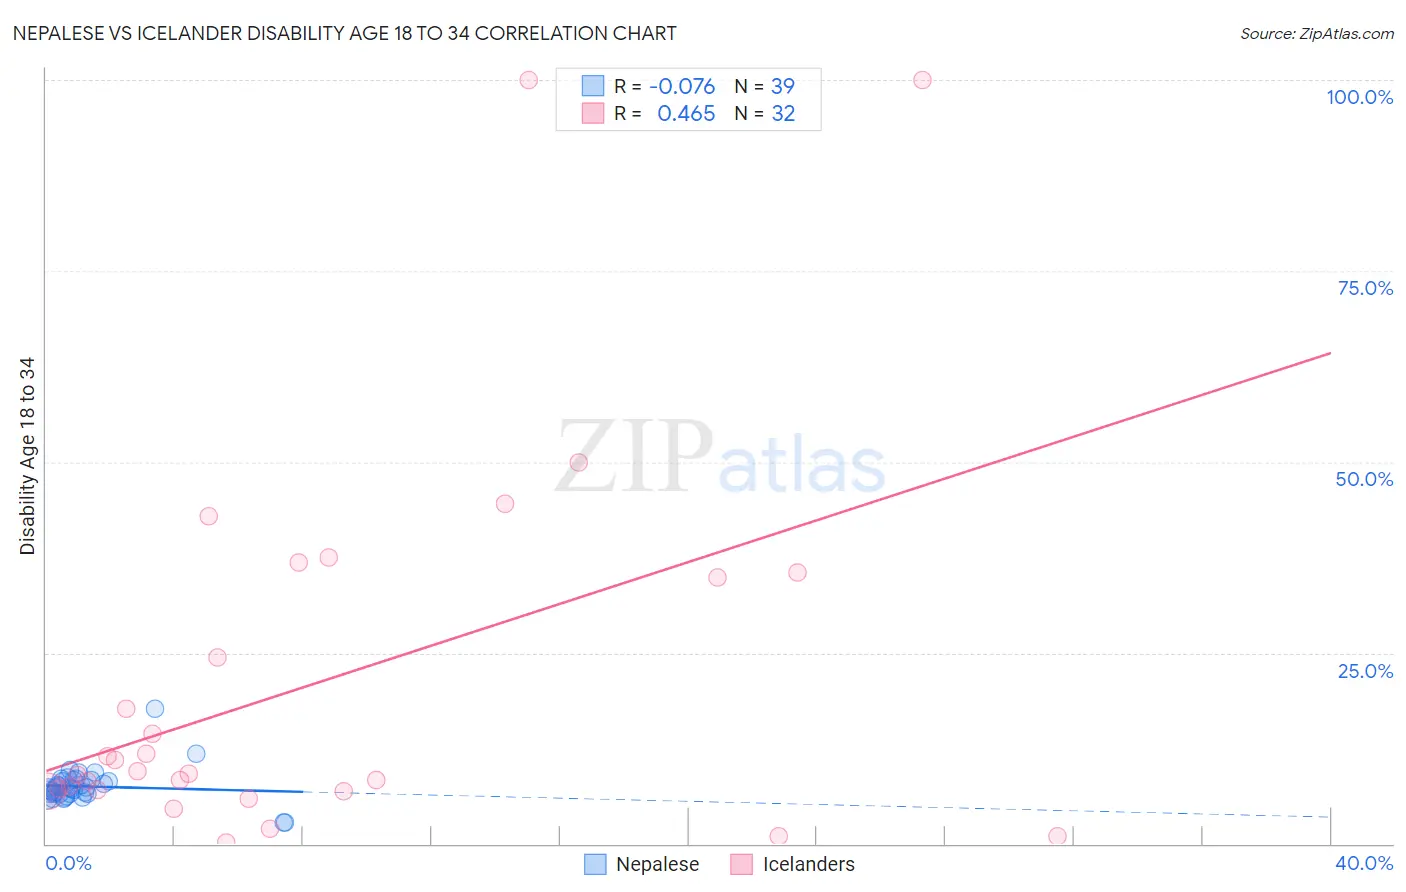
Nepalese vs Icelander Disability Age 18 to 34 Correlation Chart
The statistical analysis conducted on geographies consisting of 24,520,458 people shows a slight negative correlation between the proportion of Nepalese and percentage of population with a disability between the ages 18 and 35 in the United States with a correlation coefficient (R) of -0.076 and weighted average of 7.1%. Similarly, the statistical analysis conducted on geographies consisting of 159,438,295 people shows a moderate positive correlation between the proportion of Icelanders and percentage of population with a disability between the ages 18 and 35 in the United States with a correlation coefficient (R) of 0.465 and weighted average of 7.1%, a difference of 0.11%.
Disability Age 18 to 34 Correlation Summary
| Measurement | Nepalese | Icelander |
| Minimum | 2.8% | 0.23% |
| Maximum | 17.7% | 100.0% |
| Range | 14.9% | 99.8% |
| Mean | 7.5% | 21.1% |
| Median | 7.3% | 9.3% |
| Interquartile 25% (IQ1) | 6.5% | 7.0% |
| Interquartile 75% (IQ3) | 8.3% | 35.2% |
| Interquartile Range (IQR) | 1.8% | 28.2% |
| Standard Deviation (Sample) | 2.3% | 25.1% |
| Standard Deviation (Population) | 2.3% | 24.7% |
Demographics Similar to Nepalese and Icelanders by Disability Age 18 to 34
In terms of disability age 18 to 34, the demographic groups most similar to Nepalese are Arapaho (7.1%, a difference of 0.0%), Immigrants from Congo (7.1%, a difference of 0.040%), Italian (7.1%, a difference of 0.12%), Marshallese (7.1%, a difference of 0.24%), and Austrian (7.1%, a difference of 0.28%). Similarly, the demographic groups most similar to Icelanders are Immigrants from Congo (7.1%, a difference of 0.070%), Arapaho (7.1%, a difference of 0.11%), Immigrants from Zaire (7.1%, a difference of 0.20%), Italian (7.1%, a difference of 0.23%), and Hungarian (7.1%, a difference of 0.31%).
| Demographics | Rating | Rank | Disability Age 18 to 34 |
| Samoans | 3.2 /100 | #232 | Tragic 7.0% |
| New Zealanders | 2.7 /100 | #233 | Tragic 7.0% |
| Alsatians | 2.1 /100 | #234 | Tragic 7.0% |
| Sub-Saharan Africans | 1.7 /100 | #235 | Tragic 7.1% |
| Liberians | 1.5 /100 | #236 | Tragic 7.1% |
| Austrians | 1.3 /100 | #237 | Tragic 7.1% |
| Marshallese | 1.3 /100 | #238 | Tragic 7.1% |
| Italians | 1.2 /100 | #239 | Tragic 7.1% |
| Arapaho | 1.1 /100 | #240 | Tragic 7.1% |
| Nepalese | 1.1 /100 | #241 | Tragic 7.1% |
| Immigrants | Congo | 1.1 /100 | #242 | Tragic 7.1% |
| Icelanders | 1.0 /100 | #243 | Tragic 7.1% |
| Immigrants | Zaire | 0.9 /100 | #244 | Tragic 7.1% |
| Hungarians | 0.9 /100 | #245 | Tragic 7.1% |
| Immigrants | Liberia | 0.8 /100 | #246 | Tragic 7.1% |
| Yugoslavians | 0.8 /100 | #247 | Tragic 7.2% |
| Guamanians/Chamorros | 0.8 /100 | #248 | Tragic 7.2% |
| Malaysians | 0.7 /100 | #249 | Tragic 7.2% |
| Fijians | 0.6 /100 | #250 | Tragic 7.2% |
| Spaniards | 0.6 /100 | #251 | Tragic 7.2% |
| Poles | 0.6 /100 | #252 | Tragic 7.2% |