Nepalese vs Comanche 6th Grade
COMPARE
Nepalese
Comanche
6th Grade
6th Grade Comparison
Nepalese
Comanche
94.9%
6TH GRADE
0.0/ 100
METRIC RATING
330th/ 347
METRIC RANK
97.0%
6TH GRADE
37.9/ 100
METRIC RATING
181st/ 347
METRIC RANK
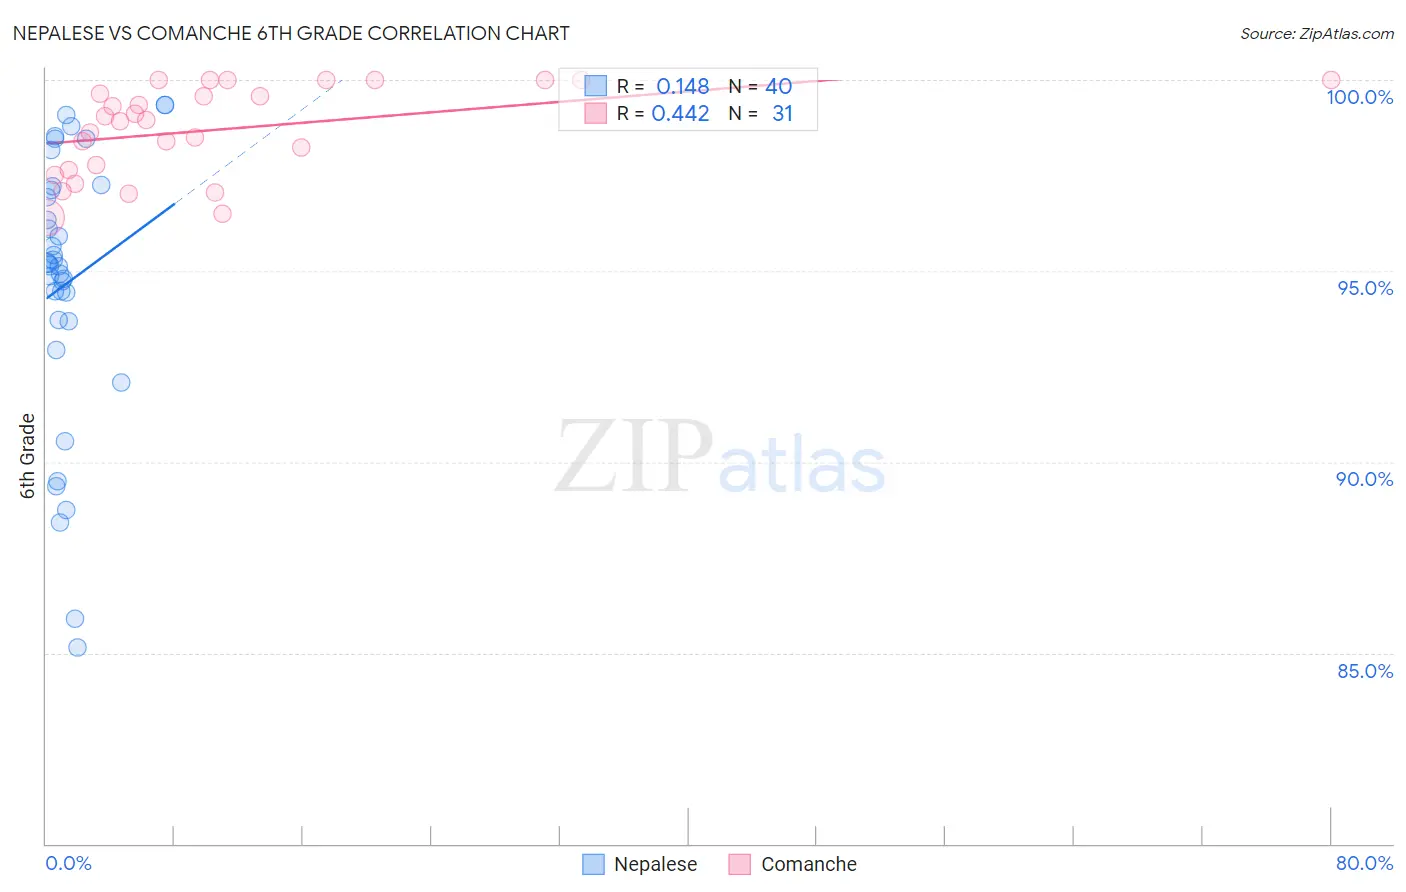
Nepalese vs Comanche 6th Grade Correlation Chart
The statistical analysis conducted on geographies consisting of 24,521,755 people shows a poor positive correlation between the proportion of Nepalese and percentage of population with at least 6th grade education in the United States with a correlation coefficient (R) of 0.148 and weighted average of 94.9%. Similarly, the statistical analysis conducted on geographies consisting of 109,786,530 people shows a moderate positive correlation between the proportion of Comanche and percentage of population with at least 6th grade education in the United States with a correlation coefficient (R) of 0.442 and weighted average of 97.0%, a difference of 2.2%.
6th Grade Correlation Summary
| Measurement | Nepalese | Comanche |
| Minimum | 85.1% | 96.4% |
| Maximum | 99.3% | 100.0% |
| Range | 14.2% | 3.6% |
| Mean | 94.7% | 98.7% |
| Median | 95.2% | 99.0% |
| Interquartile 25% (IQ1) | 93.7% | 97.6% |
| Interquartile 75% (IQ3) | 97.2% | 100.0% |
| Interquartile Range (IQR) | 3.5% | 2.4% |
| Standard Deviation (Sample) | 3.6% | 1.2% |
| Standard Deviation (Population) | 3.5% | 1.2% |
Similar Demographics by 6th Grade
Demographics Similar to Nepalese by 6th Grade
In terms of 6th grade, the demographic groups most similar to Nepalese are Immigrants from Armenia (94.9%, a difference of 0.010%), Dominican (94.9%, a difference of 0.070%), Immigrants from Honduras (94.8%, a difference of 0.11%), Mexican American Indian (95.0%, a difference of 0.14%), and Honduran (95.0%, a difference of 0.14%).
| Demographics | Rating | Rank | 6th Grade |
| Central American Indians | 0.0 /100 | #323 | Tragic 95.1% |
| Cape Verdeans | 0.0 /100 | #324 | Tragic 95.1% |
| Immigrants | Nicaragua | 0.0 /100 | #325 | Tragic 95.1% |
| Hispanics or Latinos | 0.0 /100 | #326 | Tragic 95.0% |
| Mexican American Indians | 0.0 /100 | #327 | Tragic 95.0% |
| Hondurans | 0.0 /100 | #328 | Tragic 95.0% |
| Dominicans | 0.0 /100 | #329 | Tragic 94.9% |
| Nepalese | 0.0 /100 | #330 | Tragic 94.9% |
| Immigrants | Armenia | 0.0 /100 | #331 | Tragic 94.9% |
| Immigrants | Honduras | 0.0 /100 | #332 | Tragic 94.8% |
| Immigrants | Latin America | 0.0 /100 | #333 | Tragic 94.7% |
| Immigrants | Azores | 0.0 /100 | #334 | Tragic 94.7% |
| Mexicans | 0.0 /100 | #335 | Tragic 94.6% |
| Immigrants | Dominican Republic | 0.0 /100 | #336 | Tragic 94.6% |
| Central Americans | 0.0 /100 | #337 | Tragic 94.5% |
Demographics Similar to Comanche by 6th Grade
In terms of 6th grade, the demographic groups most similar to Comanche are Immigrants from Spain (97.0%, a difference of 0.010%), Immigrants from Ukraine (97.0%, a difference of 0.010%), Immigrants from Venezuela (97.0%, a difference of 0.020%), Spanish American (97.0%, a difference of 0.020%), and Argentinean (97.0%, a difference of 0.020%).
| Demographics | Rating | Rank | 6th Grade |
| Venezuelans | 50.0 /100 | #174 | Average 97.0% |
| Immigrants | Kazakhstan | 47.3 /100 | #175 | Average 97.0% |
| Immigrants | Micronesia | 47.1 /100 | #176 | Average 97.0% |
| Mongolians | 46.7 /100 | #177 | Average 97.0% |
| Pakistanis | 46.0 /100 | #178 | Average 97.0% |
| Immigrants | Kenya | 45.3 /100 | #179 | Average 97.0% |
| Immigrants | Spain | 39.9 /100 | #180 | Fair 97.0% |
| Comanche | 37.9 /100 | #181 | Fair 97.0% |
| Immigrants | Ukraine | 35.6 /100 | #182 | Fair 97.0% |
| Immigrants | Venezuela | 34.5 /100 | #183 | Fair 97.0% |
| Spanish Americans | 33.5 /100 | #184 | Fair 97.0% |
| Argentineans | 33.0 /100 | #185 | Fair 97.0% |
| Immigrants | Egypt | 31.4 /100 | #186 | Fair 97.0% |
| Guamanians/Chamorros | 30.6 /100 | #187 | Fair 97.0% |
| Immigrants | Argentina | 30.4 /100 | #188 | Fair 97.0% |