Nepalese vs Immigrants from Cameroon 6th Grade
COMPARE
Nepalese
Immigrants from Cameroon
6th Grade
6th Grade Comparison
Nepalese
Immigrants from Cameroon
94.9%
6TH GRADE
0.0/ 100
METRIC RATING
330th/ 347
METRIC RANK
96.3%
6TH GRADE
0.1/ 100
METRIC RATING
273rd/ 347
METRIC RANK
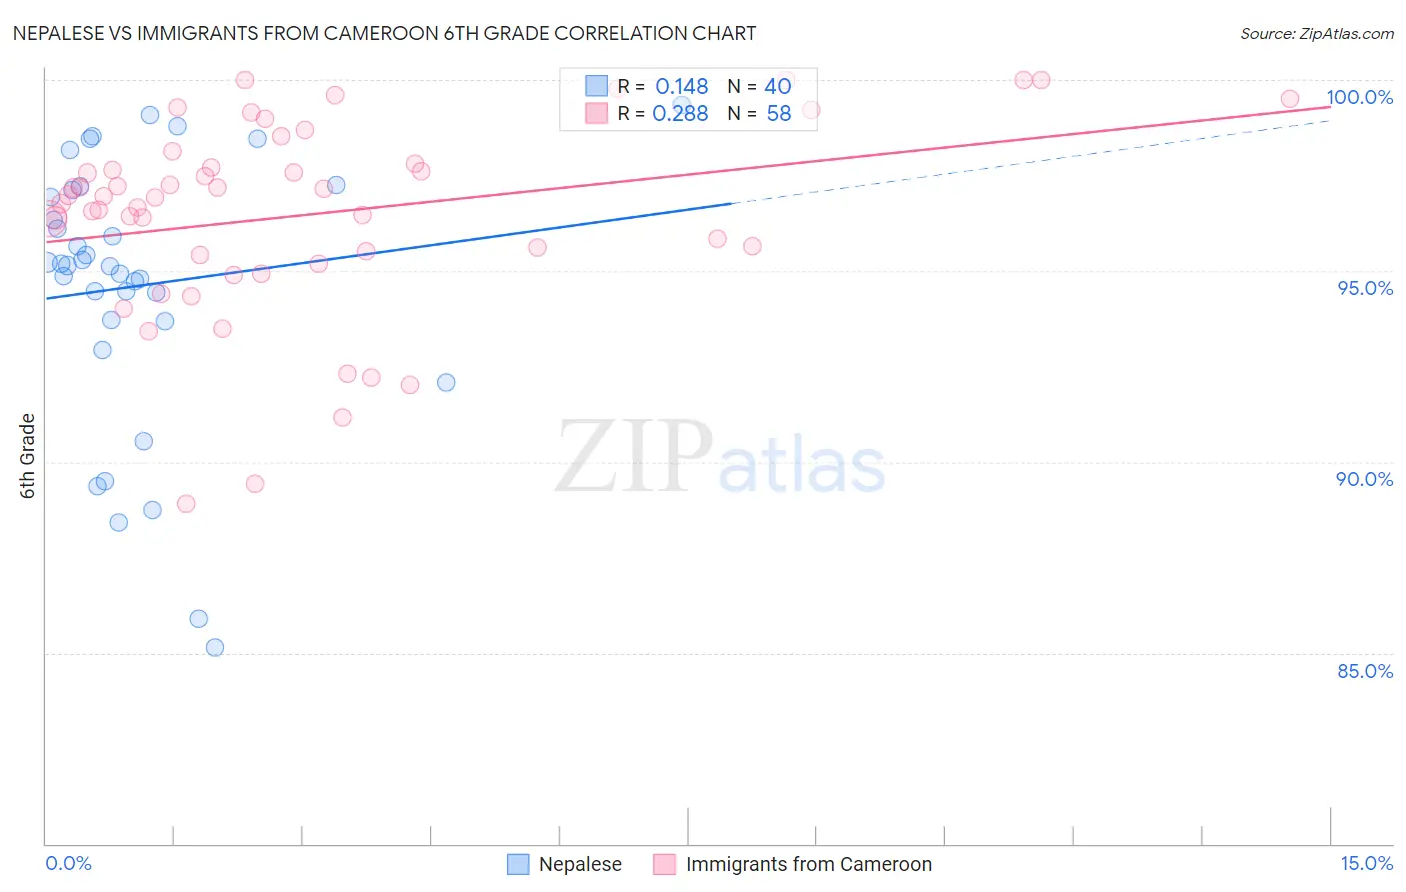
Nepalese vs Immigrants from Cameroon 6th Grade Correlation Chart
The statistical analysis conducted on geographies consisting of 24,521,755 people shows a poor positive correlation between the proportion of Nepalese and percentage of population with at least 6th grade education in the United States with a correlation coefficient (R) of 0.148 and weighted average of 94.9%. Similarly, the statistical analysis conducted on geographies consisting of 130,752,798 people shows a weak positive correlation between the proportion of Immigrants from Cameroon and percentage of population with at least 6th grade education in the United States with a correlation coefficient (R) of 0.288 and weighted average of 96.3%, a difference of 1.5%.
6th Grade Correlation Summary
| Measurement | Nepalese | Immigrants from Cameroon |
| Minimum | 85.1% | 88.9% |
| Maximum | 99.3% | 100.0% |
| Range | 14.2% | 11.1% |
| Mean | 94.7% | 96.5% |
| Median | 95.2% | 96.9% |
| Interquartile 25% (IQ1) | 93.7% | 95.4% |
| Interquartile 75% (IQ3) | 97.2% | 97.8% |
| Interquartile Range (IQR) | 3.5% | 2.4% |
| Standard Deviation (Sample) | 3.6% | 2.5% |
| Standard Deviation (Population) | 3.5% | 2.5% |
Similar Demographics by 6th Grade
Demographics Similar to Nepalese by 6th Grade
In terms of 6th grade, the demographic groups most similar to Nepalese are Immigrants from Armenia (94.9%, a difference of 0.010%), Dominican (94.9%, a difference of 0.070%), Immigrants from Honduras (94.8%, a difference of 0.11%), Mexican American Indian (95.0%, a difference of 0.14%), and Honduran (95.0%, a difference of 0.14%).
| Demographics | Rating | Rank | 6th Grade |
| Central American Indians | 0.0 /100 | #323 | Tragic 95.1% |
| Cape Verdeans | 0.0 /100 | #324 | Tragic 95.1% |
| Immigrants | Nicaragua | 0.0 /100 | #325 | Tragic 95.1% |
| Hispanics or Latinos | 0.0 /100 | #326 | Tragic 95.0% |
| Mexican American Indians | 0.0 /100 | #327 | Tragic 95.0% |
| Hondurans | 0.0 /100 | #328 | Tragic 95.0% |
| Dominicans | 0.0 /100 | #329 | Tragic 94.9% |
| Nepalese | 0.0 /100 | #330 | Tragic 94.9% |
| Immigrants | Armenia | 0.0 /100 | #331 | Tragic 94.9% |
| Immigrants | Honduras | 0.0 /100 | #332 | Tragic 94.8% |
| Immigrants | Latin America | 0.0 /100 | #333 | Tragic 94.7% |
| Immigrants | Azores | 0.0 /100 | #334 | Tragic 94.7% |
| Mexicans | 0.0 /100 | #335 | Tragic 94.6% |
| Immigrants | Dominican Republic | 0.0 /100 | #336 | Tragic 94.6% |
| Central Americans | 0.0 /100 | #337 | Tragic 94.5% |
Demographics Similar to Immigrants from Cameroon by 6th Grade
In terms of 6th grade, the demographic groups most similar to Immigrants from Cameroon are Immigrants from Philippines (96.3%, a difference of 0.0%), Immigrants from Bolivia (96.3%, a difference of 0.010%), Immigrants from Ghana (96.3%, a difference of 0.010%), Yaqui (96.3%, a difference of 0.020%), and Immigrants from Western Africa (96.3%, a difference of 0.030%).
| Demographics | Rating | Rank | 6th Grade |
| Ghanaians | 0.2 /100 | #266 | Tragic 96.4% |
| Afghans | 0.2 /100 | #267 | Tragic 96.4% |
| Immigrants | Uzbekistan | 0.2 /100 | #268 | Tragic 96.3% |
| West Indians | 0.2 /100 | #269 | Tragic 96.3% |
| Immigrants | South America | 0.2 /100 | #270 | Tragic 96.3% |
| Immigrants | Hong Kong | 0.2 /100 | #271 | Tragic 96.3% |
| Immigrants | Bolivia | 0.1 /100 | #272 | Tragic 96.3% |
| Immigrants | Cameroon | 0.1 /100 | #273 | Tragic 96.3% |
| Immigrants | Philippines | 0.1 /100 | #274 | Tragic 96.3% |
| Immigrants | Ghana | 0.1 /100 | #275 | Tragic 96.3% |
| Yaqui | 0.1 /100 | #276 | Tragic 96.3% |
| Immigrants | Western Africa | 0.1 /100 | #277 | Tragic 96.3% |
| Immigrants | Thailand | 0.1 /100 | #278 | Tragic 96.3% |
| Immigrants | Peru | 0.1 /100 | #279 | Tragic 96.2% |
| Immigrants | Afghanistan | 0.1 /100 | #280 | Tragic 96.2% |