Nepalese vs Sudanese 6th Grade
COMPARE
Nepalese
Sudanese
6th Grade
6th Grade Comparison
Nepalese
Sudanese
94.9%
6TH GRADE
0.0/ 100
METRIC RATING
330th/ 347
METRIC RANK
96.8%
6TH GRADE
13.9/ 100
METRIC RATING
203rd/ 347
METRIC RANK
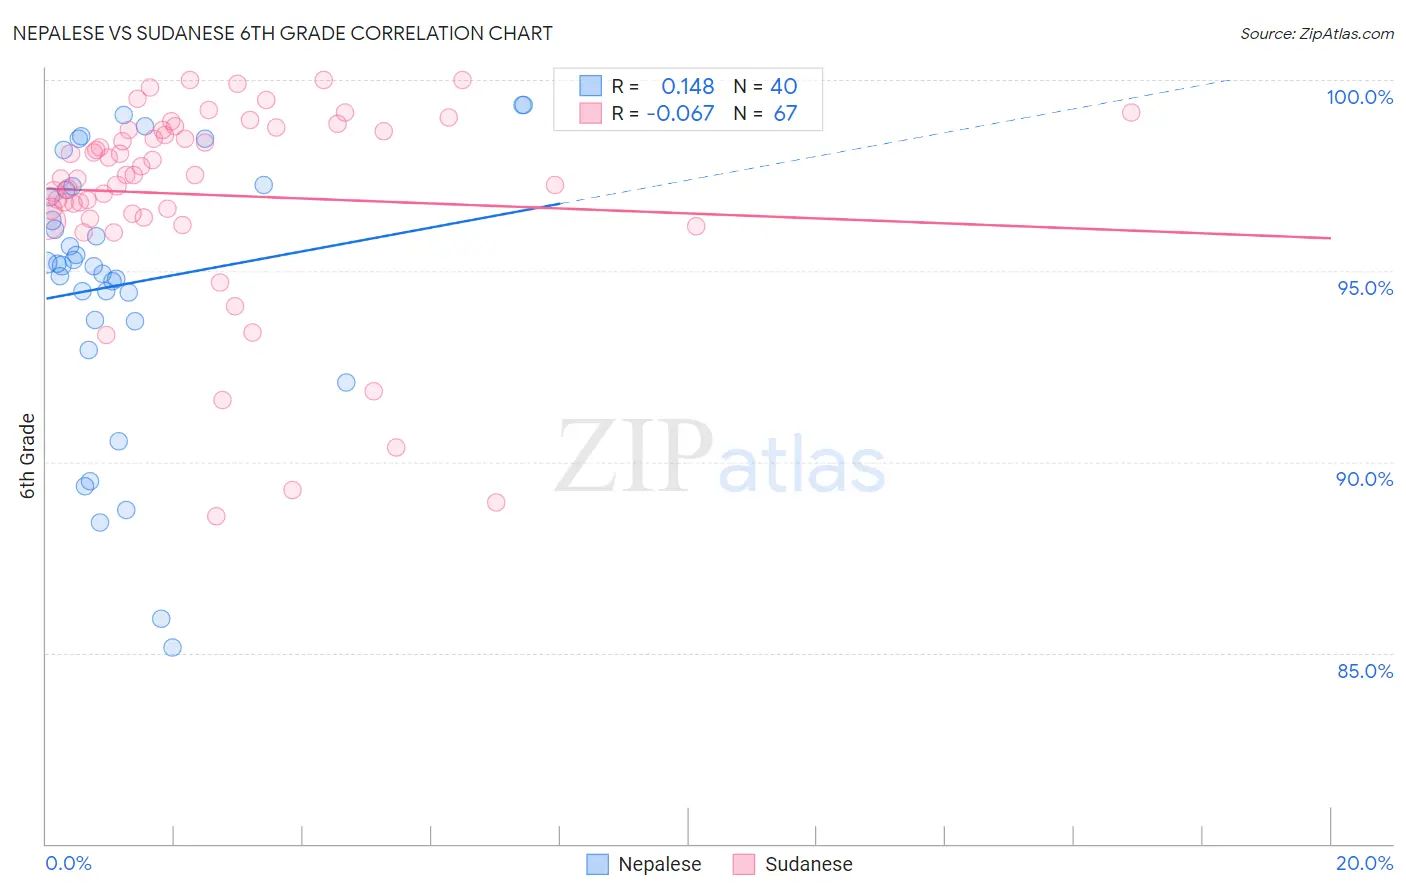
Nepalese vs Sudanese 6th Grade Correlation Chart
The statistical analysis conducted on geographies consisting of 24,521,755 people shows a poor positive correlation between the proportion of Nepalese and percentage of population with at least 6th grade education in the United States with a correlation coefficient (R) of 0.148 and weighted average of 94.9%. Similarly, the statistical analysis conducted on geographies consisting of 110,114,612 people shows a slight negative correlation between the proportion of Sudanese and percentage of population with at least 6th grade education in the United States with a correlation coefficient (R) of -0.067 and weighted average of 96.8%, a difference of 2.1%.
6th Grade Correlation Summary
| Measurement | Nepalese | Sudanese |
| Minimum | 85.1% | 88.6% |
| Maximum | 99.3% | 100.0% |
| Range | 14.2% | 11.4% |
| Mean | 94.7% | 97.0% |
| Median | 95.2% | 97.5% |
| Interquartile 25% (IQ1) | 93.7% | 96.4% |
| Interquartile 75% (IQ3) | 97.2% | 98.7% |
| Interquartile Range (IQR) | 3.5% | 2.3% |
| Standard Deviation (Sample) | 3.6% | 2.6% |
| Standard Deviation (Population) | 3.5% | 2.6% |
Similar Demographics by 6th Grade
Demographics Similar to Nepalese by 6th Grade
In terms of 6th grade, the demographic groups most similar to Nepalese are Immigrants from Armenia (94.9%, a difference of 0.010%), Dominican (94.9%, a difference of 0.070%), Immigrants from Honduras (94.8%, a difference of 0.11%), Mexican American Indian (95.0%, a difference of 0.14%), and Honduran (95.0%, a difference of 0.14%).
| Demographics | Rating | Rank | 6th Grade |
| Central American Indians | 0.0 /100 | #323 | Tragic 95.1% |
| Cape Verdeans | 0.0 /100 | #324 | Tragic 95.1% |
| Immigrants | Nicaragua | 0.0 /100 | #325 | Tragic 95.1% |
| Hispanics or Latinos | 0.0 /100 | #326 | Tragic 95.0% |
| Mexican American Indians | 0.0 /100 | #327 | Tragic 95.0% |
| Hondurans | 0.0 /100 | #328 | Tragic 95.0% |
| Dominicans | 0.0 /100 | #329 | Tragic 94.9% |
| Nepalese | 0.0 /100 | #330 | Tragic 94.9% |
| Immigrants | Armenia | 0.0 /100 | #331 | Tragic 94.9% |
| Immigrants | Honduras | 0.0 /100 | #332 | Tragic 94.8% |
| Immigrants | Latin America | 0.0 /100 | #333 | Tragic 94.7% |
| Immigrants | Azores | 0.0 /100 | #334 | Tragic 94.7% |
| Mexicans | 0.0 /100 | #335 | Tragic 94.6% |
| Immigrants | Dominican Republic | 0.0 /100 | #336 | Tragic 94.6% |
| Central Americans | 0.0 /100 | #337 | Tragic 94.5% |
Demographics Similar to Sudanese by 6th Grade
In terms of 6th grade, the demographic groups most similar to Sudanese are Immigrants from Chile (96.8%, a difference of 0.0%), Immigrants from Bahamas (96.8%, a difference of 0.0%), African (96.9%, a difference of 0.010%), Immigrants from Zaire (96.9%, a difference of 0.010%), and Native/Alaskan (96.8%, a difference of 0.010%).
| Demographics | Rating | Rank | 6th Grade |
| Immigrants | Uganda | 21.2 /100 | #196 | Fair 96.9% |
| Brazilians | 20.1 /100 | #197 | Fair 96.9% |
| Immigrants | Albania | 18.8 /100 | #198 | Poor 96.9% |
| Immigrants | Northern Africa | 15.7 /100 | #199 | Poor 96.9% |
| Africans | 14.8 /100 | #200 | Poor 96.9% |
| Immigrants | Zaire | 14.5 /100 | #201 | Poor 96.9% |
| Immigrants | Chile | 14.2 /100 | #202 | Poor 96.8% |
| Sudanese | 13.9 /100 | #203 | Poor 96.8% |
| Immigrants | Bahamas | 13.8 /100 | #204 | Poor 96.8% |
| Natives/Alaskans | 13.0 /100 | #205 | Poor 96.8% |
| Laotians | 11.8 /100 | #206 | Poor 96.8% |
| Iraqis | 11.7 /100 | #207 | Poor 96.8% |
| Samoans | 11.0 /100 | #208 | Poor 96.8% |
| Immigrants | Oceania | 11.0 /100 | #209 | Poor 96.8% |
| Immigrants | Nepal | 10.1 /100 | #210 | Poor 96.8% |