Immigrants from Venezuela vs Aleut 6th Grade
COMPARE
Immigrants from Venezuela
Aleut
6th Grade
6th Grade Comparison
Immigrants from Venezuela
Aleuts
97.0%
6TH GRADE
34.5/ 100
METRIC RATING
183rd/ 347
METRIC RANK
97.7%
6TH GRADE
99.8/ 100
METRIC RATING
55th/ 347
METRIC RANK
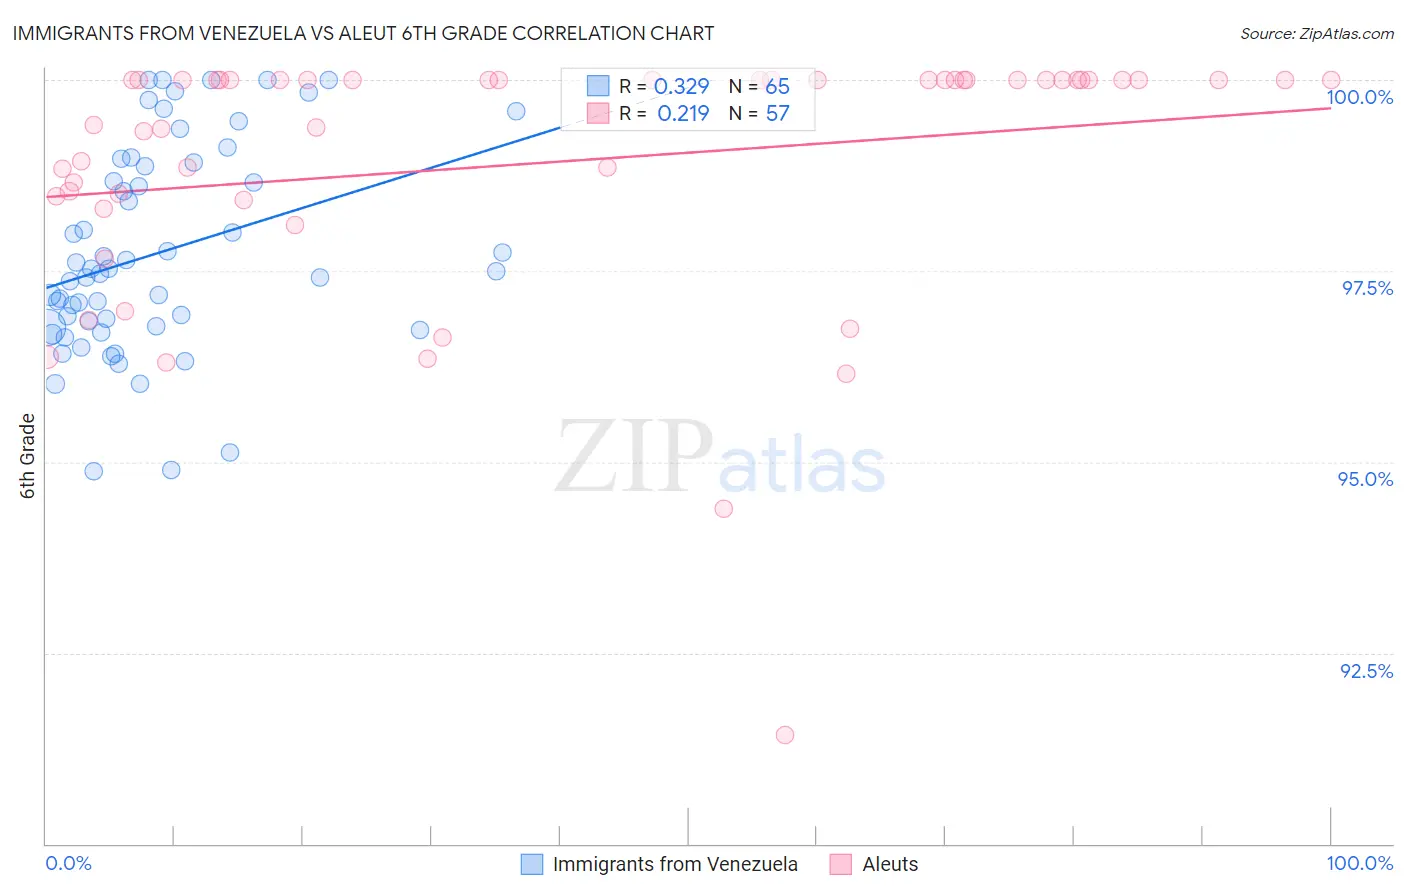
Immigrants from Venezuela vs Aleut 6th Grade Correlation Chart
The statistical analysis conducted on geographies consisting of 287,866,009 people shows a mild positive correlation between the proportion of Immigrants from Venezuela and percentage of population with at least 6th grade education in the United States with a correlation coefficient (R) of 0.329 and weighted average of 97.0%. Similarly, the statistical analysis conducted on geographies consisting of 61,781,058 people shows a weak positive correlation between the proportion of Aleuts and percentage of population with at least 6th grade education in the United States with a correlation coefficient (R) of 0.219 and weighted average of 97.7%, a difference of 0.79%.
6th Grade Correlation Summary
| Measurement | Immigrants from Venezuela | Aleut |
| Minimum | 94.9% | 91.4% |
| Maximum | 100.0% | 100.0% |
| Range | 5.1% | 8.6% |
| Mean | 97.7% | 98.9% |
| Median | 97.5% | 100.0% |
| Interquartile 25% (IQ1) | 96.8% | 98.5% |
| Interquartile 75% (IQ3) | 98.9% | 100.0% |
| Interquartile Range (IQR) | 2.1% | 1.5% |
| Standard Deviation (Sample) | 1.3% | 1.7% |
| Standard Deviation (Population) | 1.3% | 1.7% |
Similar Demographics by 6th Grade
Demographics Similar to Immigrants from Venezuela by 6th Grade
In terms of 6th grade, the demographic groups most similar to Immigrants from Venezuela are Spanish American (97.0%, a difference of 0.0%), Immigrants from Ukraine (97.0%, a difference of 0.010%), Argentinean (97.0%, a difference of 0.010%), Comanche (97.0%, a difference of 0.020%), and Immigrants from Egypt (97.0%, a difference of 0.020%).
| Demographics | Rating | Rank | 6th Grade |
| Immigrants | Micronesia | 47.1 /100 | #176 | Average 97.0% |
| Mongolians | 46.7 /100 | #177 | Average 97.0% |
| Pakistanis | 46.0 /100 | #178 | Average 97.0% |
| Immigrants | Kenya | 45.3 /100 | #179 | Average 97.0% |
| Immigrants | Spain | 39.9 /100 | #180 | Fair 97.0% |
| Comanche | 37.9 /100 | #181 | Fair 97.0% |
| Immigrants | Ukraine | 35.6 /100 | #182 | Fair 97.0% |
| Immigrants | Venezuela | 34.5 /100 | #183 | Fair 97.0% |
| Spanish Americans | 33.5 /100 | #184 | Fair 97.0% |
| Argentineans | 33.0 /100 | #185 | Fair 97.0% |
| Immigrants | Egypt | 31.4 /100 | #186 | Fair 97.0% |
| Guamanians/Chamorros | 30.6 /100 | #187 | Fair 97.0% |
| Immigrants | Argentina | 30.4 /100 | #188 | Fair 97.0% |
| Blacks/African Americans | 30.2 /100 | #189 | Fair 97.0% |
| Dutch West Indians | 28.3 /100 | #190 | Fair 96.9% |
Demographics Similar to Aleuts by 6th Grade
In terms of 6th grade, the demographic groups most similar to Aleuts are Creek (97.7%, a difference of 0.0%), Maltese (97.8%, a difference of 0.010%), Australian (97.8%, a difference of 0.010%), Slavic (97.8%, a difference of 0.010%), and Austrian (97.7%, a difference of 0.010%).
| Demographics | Rating | Rank | 6th Grade |
| Celtics | 99.9 /100 | #48 | Exceptional 97.8% |
| Estonians | 99.8 /100 | #49 | Exceptional 97.8% |
| Immigrants | Scotland | 99.8 /100 | #50 | Exceptional 97.8% |
| Maltese | 99.8 /100 | #51 | Exceptional 97.8% |
| Australians | 99.8 /100 | #52 | Exceptional 97.8% |
| Slavs | 99.8 /100 | #53 | Exceptional 97.8% |
| Creek | 99.8 /100 | #54 | Exceptional 97.7% |
| Aleuts | 99.8 /100 | #55 | Exceptional 97.7% |
| Austrians | 99.8 /100 | #56 | Exceptional 97.7% |
| Whites/Caucasians | 99.8 /100 | #57 | Exceptional 97.7% |
| Greeks | 99.8 /100 | #58 | Exceptional 97.7% |
| Americans | 99.8 /100 | #59 | Exceptional 97.7% |
| Immigrants | Canada | 99.8 /100 | #60 | Exceptional 97.7% |
| Serbians | 99.7 /100 | #61 | Exceptional 97.7% |
| Immigrants | North America | 99.7 /100 | #62 | Exceptional 97.7% |