Navajo vs Puget Sound Salish 11th Grade
COMPARE
Navajo
Puget Sound Salish
11th Grade
11th Grade Comparison
Navajo
Puget Sound Salish
90.0%
11TH GRADE
0.0/ 100
METRIC RATING
297th/ 347
METRIC RANK
93.6%
11TH GRADE
99.1/ 100
METRIC RATING
93rd/ 347
METRIC RANK
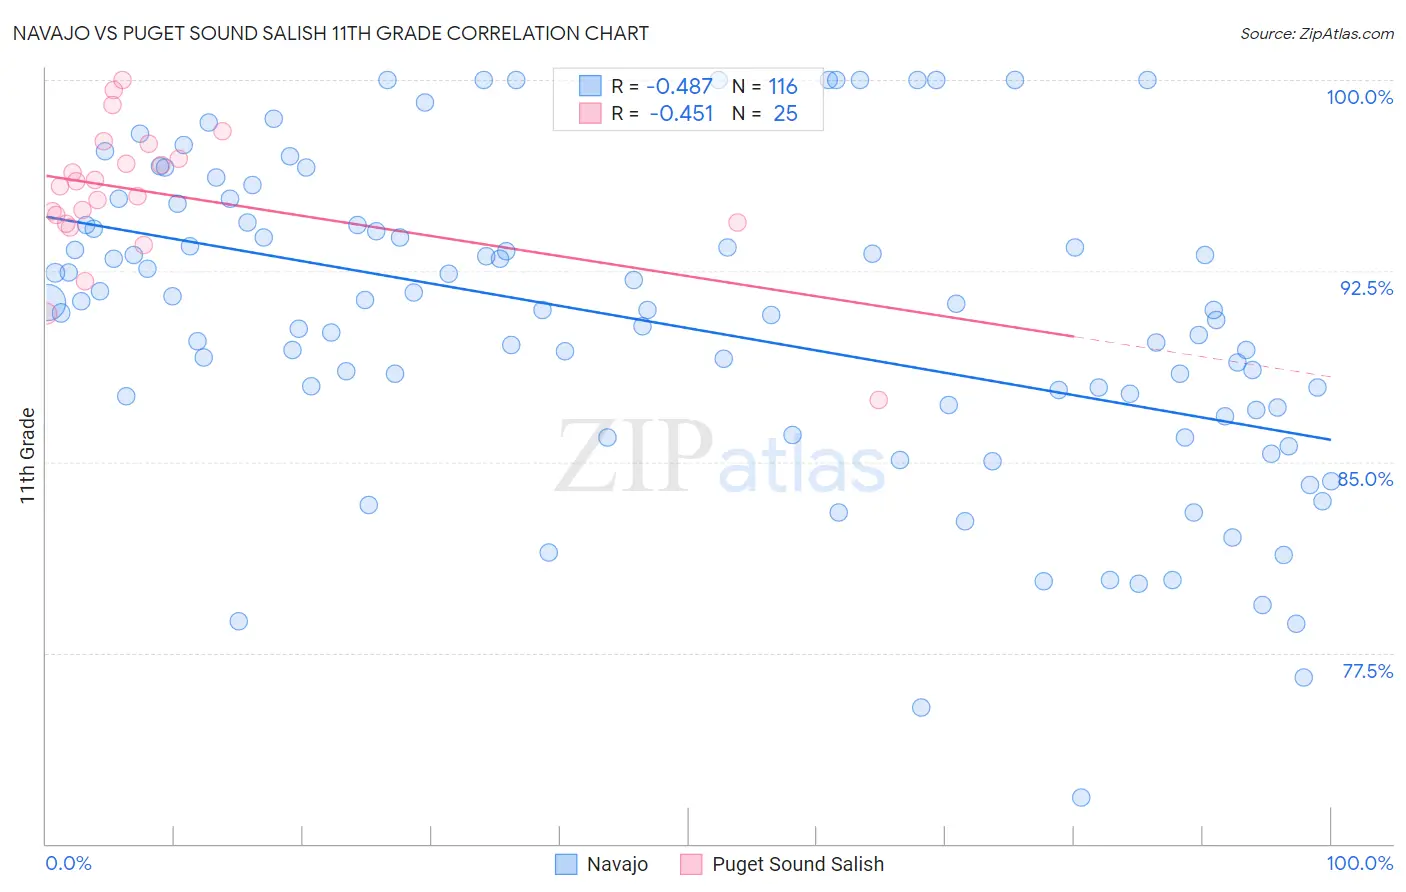
Navajo vs Puget Sound Salish 11th Grade Correlation Chart
The statistical analysis conducted on geographies consisting of 224,872,858 people shows a moderate negative correlation between the proportion of Navajo and percentage of population with at least 11th grade education in the United States with a correlation coefficient (R) of -0.487 and weighted average of 90.0%. Similarly, the statistical analysis conducted on geographies consisting of 46,155,775 people shows a moderate negative correlation between the proportion of Puget Sound Salish and percentage of population with at least 11th grade education in the United States with a correlation coefficient (R) of -0.451 and weighted average of 93.6%, a difference of 4.0%.
11th Grade Correlation Summary
| Measurement | Navajo | Puget Sound Salish |
| Minimum | 71.8% | 87.4% |
| Maximum | 100.0% | 100.0% |
| Range | 28.2% | 12.6% |
| Mean | 90.4% | 95.5% |
| Median | 91.0% | 95.8% |
| Interquartile 25% (IQ1) | 87.1% | 94.4% |
| Interquartile 75% (IQ3) | 94.2% | 97.2% |
| Interquartile Range (IQR) | 7.2% | 2.8% |
| Standard Deviation (Sample) | 6.1% | 2.7% |
| Standard Deviation (Population) | 6.1% | 2.7% |
Similar Demographics by 11th Grade
Demographics Similar to Navajo by 11th Grade
In terms of 11th grade, the demographic groups most similar to Navajo are Fijian (90.0%, a difference of 0.040%), Immigrants from Vietnam (90.0%, a difference of 0.060%), Immigrants from Fiji (89.9%, a difference of 0.070%), Japanese (89.9%, a difference of 0.10%), and Immigrants from Haiti (89.9%, a difference of 0.11%).
| Demographics | Rating | Rank | 11th Grade |
| Indonesians | 0.0 /100 | #290 | Tragic 90.3% |
| Haitians | 0.0 /100 | #291 | Tragic 90.3% |
| Cubans | 0.0 /100 | #292 | Tragic 90.2% |
| Natives/Alaskans | 0.0 /100 | #293 | Tragic 90.2% |
| Immigrants | Grenada | 0.0 /100 | #294 | Tragic 90.1% |
| Immigrants | Vietnam | 0.0 /100 | #295 | Tragic 90.0% |
| Fijians | 0.0 /100 | #296 | Tragic 90.0% |
| Navajo | 0.0 /100 | #297 | Tragic 90.0% |
| Immigrants | Fiji | 0.0 /100 | #298 | Tragic 89.9% |
| Japanese | 0.0 /100 | #299 | Tragic 89.9% |
| Immigrants | Haiti | 0.0 /100 | #300 | Tragic 89.9% |
| Guyanese | 0.0 /100 | #301 | Tragic 89.9% |
| Immigrants | Guyana | 0.0 /100 | #302 | Tragic 89.7% |
| Immigrants | Immigrants | 0.0 /100 | #303 | Tragic 89.7% |
| Yuman | 0.0 /100 | #304 | Tragic 89.7% |
Demographics Similar to Puget Sound Salish by 11th Grade
In terms of 11th grade, the demographic groups most similar to Puget Sound Salish are Immigrants from Bulgaria (93.6%, a difference of 0.020%), Swiss (93.6%, a difference of 0.020%), Immigrants from France (93.6%, a difference of 0.020%), South African (93.6%, a difference of 0.030%), and Ottawa (93.6%, a difference of 0.040%).
| Demographics | Rating | Rank | 11th Grade |
| Immigrants | South Central Asia | 99.2 /100 | #86 | Exceptional 93.6% |
| Immigrants | Western Europe | 99.2 /100 | #87 | Exceptional 93.6% |
| Cambodians | 99.2 /100 | #88 | Exceptional 93.6% |
| Burmese | 99.2 /100 | #89 | Exceptional 93.6% |
| Ottawa | 99.2 /100 | #90 | Exceptional 93.6% |
| South Africans | 99.2 /100 | #91 | Exceptional 93.6% |
| Immigrants | Bulgaria | 99.1 /100 | #92 | Exceptional 93.6% |
| Puget Sound Salish | 99.1 /100 | #93 | Exceptional 93.6% |
| Swiss | 99.0 /100 | #94 | Exceptional 93.6% |
| Immigrants | France | 99.0 /100 | #95 | Exceptional 93.6% |
| Immigrants | Turkey | 98.9 /100 | #96 | Exceptional 93.5% |
| Immigrants | Iran | 98.9 /100 | #97 | Exceptional 93.5% |
| Immigrants | Israel | 98.8 /100 | #98 | Exceptional 93.5% |
| Menominee | 98.7 /100 | #99 | Exceptional 93.5% |
| Immigrants | North Macedonia | 98.7 /100 | #100 | Exceptional 93.5% |