Navajo vs Immigrants from Bosnia and Herzegovina 11th Grade
COMPARE
Navajo
Immigrants from Bosnia and Herzegovina
11th Grade
11th Grade Comparison
Navajo
Immigrants from Bosnia and Herzegovina
90.0%
11TH GRADE
0.0/ 100
METRIC RATING
297th/ 347
METRIC RANK
93.0%
11TH GRADE
89.0/ 100
METRIC RATING
132nd/ 347
METRIC RANK
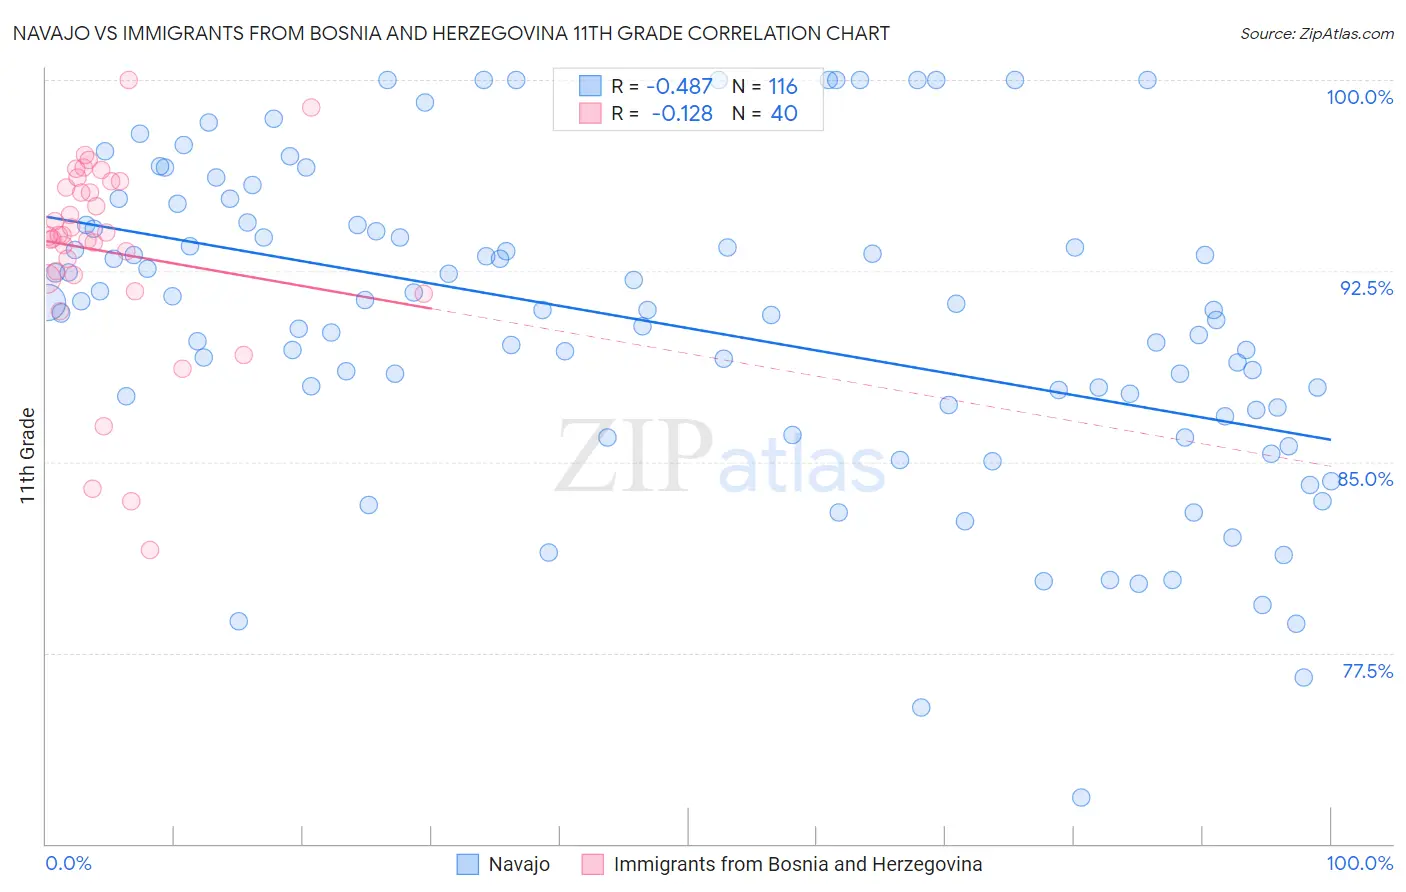
Navajo vs Immigrants from Bosnia and Herzegovina 11th Grade Correlation Chart
The statistical analysis conducted on geographies consisting of 224,872,858 people shows a moderate negative correlation between the proportion of Navajo and percentage of population with at least 11th grade education in the United States with a correlation coefficient (R) of -0.487 and weighted average of 90.0%. Similarly, the statistical analysis conducted on geographies consisting of 156,819,615 people shows a poor negative correlation between the proportion of Immigrants from Bosnia and Herzegovina and percentage of population with at least 11th grade education in the United States with a correlation coefficient (R) of -0.128 and weighted average of 93.0%, a difference of 3.3%.
11th Grade Correlation Summary
| Measurement | Navajo | Immigrants from Bosnia and Herzegovina |
| Minimum | 71.8% | 81.5% |
| Maximum | 100.0% | 100.0% |
| Range | 28.2% | 18.5% |
| Mean | 90.4% | 93.3% |
| Median | 91.0% | 93.9% |
| Interquartile 25% (IQ1) | 87.1% | 92.3% |
| Interquartile 75% (IQ3) | 94.2% | 95.9% |
| Interquartile Range (IQR) | 7.2% | 3.6% |
| Standard Deviation (Sample) | 6.1% | 3.9% |
| Standard Deviation (Population) | 6.1% | 3.9% |
Similar Demographics by 11th Grade
Demographics Similar to Navajo by 11th Grade
In terms of 11th grade, the demographic groups most similar to Navajo are Fijian (90.0%, a difference of 0.040%), Immigrants from Vietnam (90.0%, a difference of 0.060%), Immigrants from Fiji (89.9%, a difference of 0.070%), Japanese (89.9%, a difference of 0.10%), and Immigrants from Haiti (89.9%, a difference of 0.11%).
| Demographics | Rating | Rank | 11th Grade |
| Indonesians | 0.0 /100 | #290 | Tragic 90.3% |
| Haitians | 0.0 /100 | #291 | Tragic 90.3% |
| Cubans | 0.0 /100 | #292 | Tragic 90.2% |
| Natives/Alaskans | 0.0 /100 | #293 | Tragic 90.2% |
| Immigrants | Grenada | 0.0 /100 | #294 | Tragic 90.1% |
| Immigrants | Vietnam | 0.0 /100 | #295 | Tragic 90.0% |
| Fijians | 0.0 /100 | #296 | Tragic 90.0% |
| Navajo | 0.0 /100 | #297 | Tragic 90.0% |
| Immigrants | Fiji | 0.0 /100 | #298 | Tragic 89.9% |
| Japanese | 0.0 /100 | #299 | Tragic 89.9% |
| Immigrants | Haiti | 0.0 /100 | #300 | Tragic 89.9% |
| Guyanese | 0.0 /100 | #301 | Tragic 89.9% |
| Immigrants | Guyana | 0.0 /100 | #302 | Tragic 89.7% |
| Immigrants | Immigrants | 0.0 /100 | #303 | Tragic 89.7% |
| Yuman | 0.0 /100 | #304 | Tragic 89.7% |
Demographics Similar to Immigrants from Bosnia and Herzegovina by 11th Grade
In terms of 11th grade, the demographic groups most similar to Immigrants from Bosnia and Herzegovina are Albanian (93.0%, a difference of 0.010%), Egyptian (93.0%, a difference of 0.010%), Immigrants from Ukraine (93.0%, a difference of 0.020%), Mongolian (93.0%, a difference of 0.030%), and Delaware (93.0%, a difference of 0.040%).
| Demographics | Rating | Rank | 11th Grade |
| Immigrants | Sri Lanka | 95.6 /100 | #125 | Exceptional 93.2% |
| Basques | 95.2 /100 | #126 | Exceptional 93.2% |
| Immigrants | Kazakhstan | 92.4 /100 | #127 | Exceptional 93.1% |
| Immigrants | Jordan | 92.4 /100 | #128 | Exceptional 93.1% |
| Immigrants | Ukraine | 89.8 /100 | #129 | Excellent 93.0% |
| Albanians | 89.5 /100 | #130 | Excellent 93.0% |
| Egyptians | 89.5 /100 | #131 | Excellent 93.0% |
| Immigrants | Bosnia and Herzegovina | 89.0 /100 | #132 | Excellent 93.0% |
| Mongolians | 87.6 /100 | #133 | Excellent 93.0% |
| Delaware | 87.3 /100 | #134 | Excellent 93.0% |
| Immigrants | Italy | 86.6 /100 | #135 | Excellent 92.9% |
| Cree | 85.9 /100 | #136 | Excellent 92.9% |
| Arabs | 85.4 /100 | #137 | Excellent 92.9% |
| Immigrants | Brazil | 85.1 /100 | #138 | Excellent 92.9% |
| Crow | 84.1 /100 | #139 | Excellent 92.9% |