Navajo vs French 11th Grade
COMPARE
Navajo
French
11th Grade
11th Grade Comparison
Navajo
French
90.0%
11TH GRADE
0.0/ 100
METRIC RATING
297th/ 347
METRIC RANK
94.1%
11TH GRADE
99.9/ 100
METRIC RATING
50th/ 347
METRIC RANK
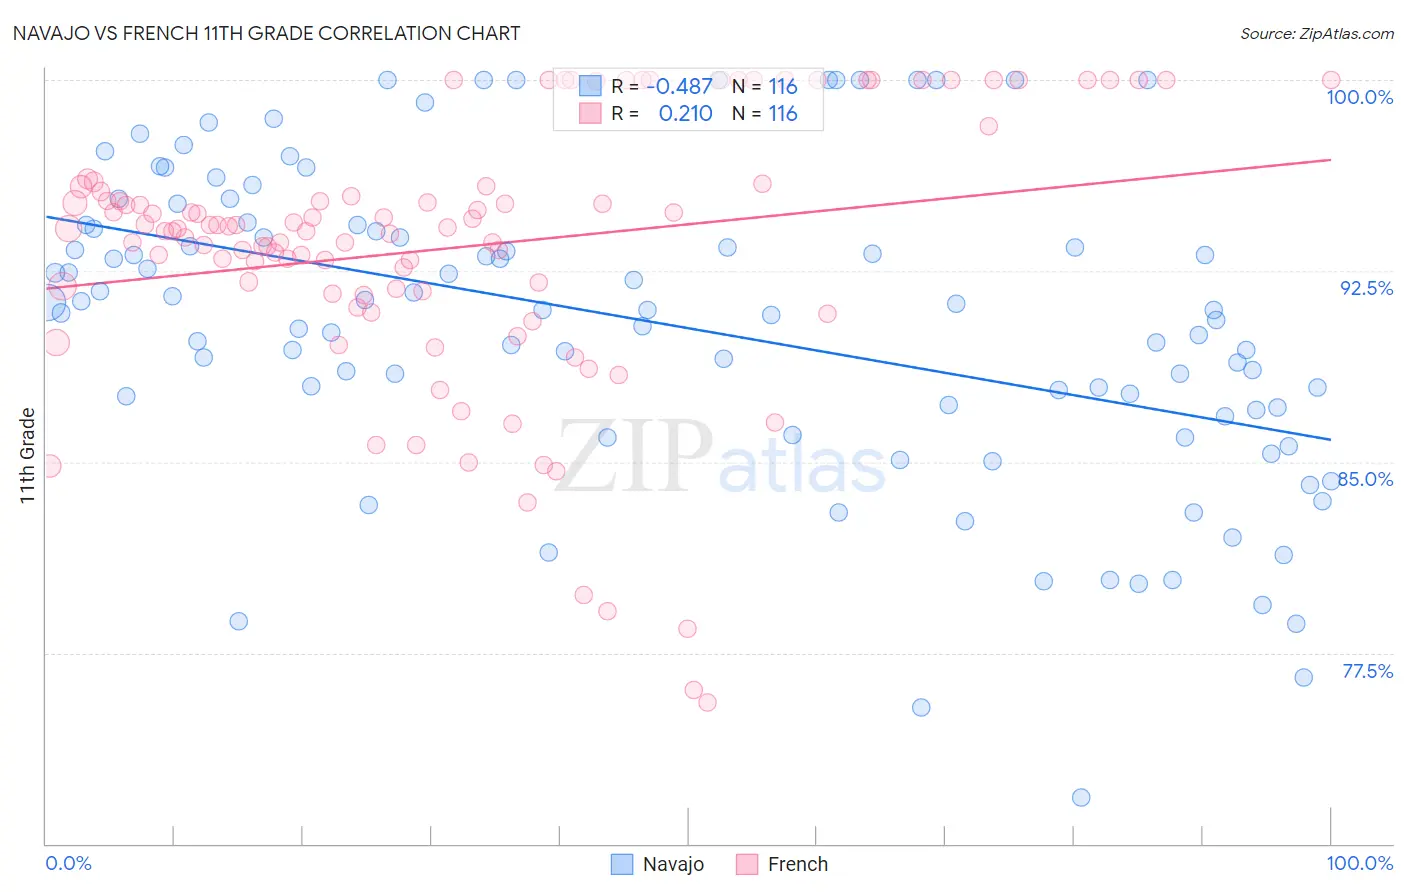
Navajo vs French 11th Grade Correlation Chart
The statistical analysis conducted on geographies consisting of 224,872,858 people shows a moderate negative correlation between the proportion of Navajo and percentage of population with at least 11th grade education in the United States with a correlation coefficient (R) of -0.487 and weighted average of 90.0%. Similarly, the statistical analysis conducted on geographies consisting of 572,427,471 people shows a weak positive correlation between the proportion of French and percentage of population with at least 11th grade education in the United States with a correlation coefficient (R) of 0.210 and weighted average of 94.1%, a difference of 4.5%.
11th Grade Correlation Summary
| Measurement | Navajo | French |
| Minimum | 71.8% | 75.6% |
| Maximum | 100.0% | 100.0% |
| Range | 28.2% | 24.4% |
| Mean | 90.4% | 93.4% |
| Median | 91.0% | 94.2% |
| Interquartile 25% (IQ1) | 87.1% | 91.7% |
| Interquartile 75% (IQ3) | 94.2% | 95.8% |
| Interquartile Range (IQR) | 7.2% | 4.1% |
| Standard Deviation (Sample) | 6.1% | 5.3% |
| Standard Deviation (Population) | 6.1% | 5.3% |
Similar Demographics by 11th Grade
Demographics Similar to Navajo by 11th Grade
In terms of 11th grade, the demographic groups most similar to Navajo are Fijian (90.0%, a difference of 0.040%), Immigrants from Vietnam (90.0%, a difference of 0.060%), Immigrants from Fiji (89.9%, a difference of 0.070%), Japanese (89.9%, a difference of 0.10%), and Immigrants from Haiti (89.9%, a difference of 0.11%).
| Demographics | Rating | Rank | 11th Grade |
| Indonesians | 0.0 /100 | #290 | Tragic 90.3% |
| Haitians | 0.0 /100 | #291 | Tragic 90.3% |
| Cubans | 0.0 /100 | #292 | Tragic 90.2% |
| Natives/Alaskans | 0.0 /100 | #293 | Tragic 90.2% |
| Immigrants | Grenada | 0.0 /100 | #294 | Tragic 90.1% |
| Immigrants | Vietnam | 0.0 /100 | #295 | Tragic 90.0% |
| Fijians | 0.0 /100 | #296 | Tragic 90.0% |
| Navajo | 0.0 /100 | #297 | Tragic 90.0% |
| Immigrants | Fiji | 0.0 /100 | #298 | Tragic 89.9% |
| Japanese | 0.0 /100 | #299 | Tragic 89.9% |
| Immigrants | Haiti | 0.0 /100 | #300 | Tragic 89.9% |
| Guyanese | 0.0 /100 | #301 | Tragic 89.9% |
| Immigrants | Guyana | 0.0 /100 | #302 | Tragic 89.7% |
| Immigrants | Immigrants | 0.0 /100 | #303 | Tragic 89.7% |
| Yuman | 0.0 /100 | #304 | Tragic 89.7% |
Demographics Similar to French by 11th Grade
In terms of 11th grade, the demographic groups most similar to French are Macedonian (94.1%, a difference of 0.0%), Slavic (94.1%, a difference of 0.0%), Filipino (94.1%, a difference of 0.010%), Serbian (94.1%, a difference of 0.020%), and Australian (94.1%, a difference of 0.030%).
| Demographics | Rating | Rank | 11th Grade |
| Greeks | 99.9 /100 | #43 | Exceptional 94.1% |
| Immigrants | Ireland | 99.9 /100 | #44 | Exceptional 94.1% |
| Australians | 99.9 /100 | #45 | Exceptional 94.1% |
| Serbians | 99.9 /100 | #46 | Exceptional 94.1% |
| Filipinos | 99.9 /100 | #47 | Exceptional 94.1% |
| Macedonians | 99.9 /100 | #48 | Exceptional 94.1% |
| Slavs | 99.9 /100 | #49 | Exceptional 94.1% |
| French | 99.9 /100 | #50 | Exceptional 94.1% |
| Turks | 99.9 /100 | #51 | Exceptional 94.0% |
| Immigrants | Canada | 99.9 /100 | #52 | Exceptional 94.0% |
| Immigrants | Australia | 99.9 /100 | #53 | Exceptional 94.0% |
| Immigrants | North America | 99.9 /100 | #54 | Exceptional 94.0% |
| Czechoslovakians | 99.9 /100 | #55 | Exceptional 94.0% |
| French Canadians | 99.9 /100 | #56 | Exceptional 94.0% |
| New Zealanders | 99.9 /100 | #57 | Exceptional 94.0% |