Navajo vs Immigrants from St. Vincent and the Grenadines 11th Grade
COMPARE
Navajo
Immigrants from St. Vincent and the Grenadines
11th Grade
11th Grade Comparison
Navajo
Immigrants from St. Vincent and the Grenadines
90.0%
11TH GRADE
0.0/ 100
METRIC RATING
297th/ 347
METRIC RANK
90.7%
11TH GRADE
0.0/ 100
METRIC RATING
282nd/ 347
METRIC RANK
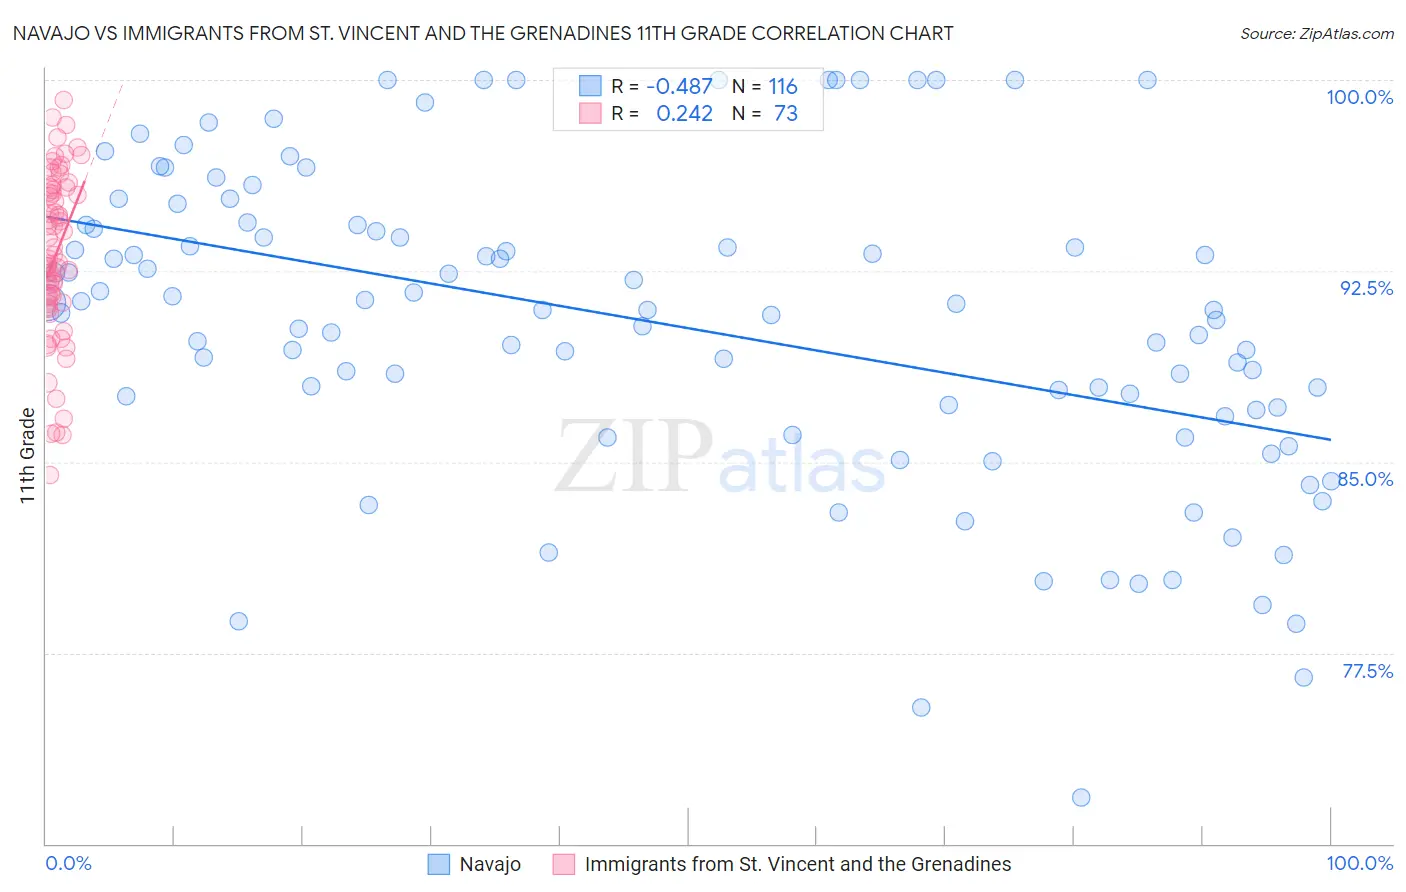
Navajo vs Immigrants from St. Vincent and the Grenadines 11th Grade Correlation Chart
The statistical analysis conducted on geographies consisting of 224,872,858 people shows a moderate negative correlation between the proportion of Navajo and percentage of population with at least 11th grade education in the United States with a correlation coefficient (R) of -0.487 and weighted average of 90.0%. Similarly, the statistical analysis conducted on geographies consisting of 56,191,418 people shows a weak positive correlation between the proportion of Immigrants from St. Vincent and the Grenadines and percentage of population with at least 11th grade education in the United States with a correlation coefficient (R) of 0.242 and weighted average of 90.7%, a difference of 0.75%.
11th Grade Correlation Summary
| Measurement | Navajo | Immigrants from St. Vincent and the Grenadines |
| Minimum | 71.8% | 84.5% |
| Maximum | 100.0% | 99.2% |
| Range | 28.2% | 14.7% |
| Mean | 90.4% | 93.1% |
| Median | 91.0% | 93.0% |
| Interquartile 25% (IQ1) | 87.1% | 91.2% |
| Interquartile 75% (IQ3) | 94.2% | 95.7% |
| Interquartile Range (IQR) | 7.2% | 4.5% |
| Standard Deviation (Sample) | 6.1% | 3.3% |
| Standard Deviation (Population) | 6.1% | 3.3% |
Demographics Similar to Navajo and Immigrants from St. Vincent and the Grenadines by 11th Grade
In terms of 11th grade, the demographic groups most similar to Navajo are Fijian (90.0%, a difference of 0.040%), Immigrants from Vietnam (90.0%, a difference of 0.060%), Immigrants from Fiji (89.9%, a difference of 0.070%), Japanese (89.9%, a difference of 0.10%), and Immigrants from Grenada (90.1%, a difference of 0.16%). Similarly, the demographic groups most similar to Immigrants from St. Vincent and the Grenadines are Dutch West Indian (90.7%, a difference of 0.010%), Immigrants from Barbados (90.7%, a difference of 0.010%), Sri Lankan (90.7%, a difference of 0.060%), Barbadian (90.8%, a difference of 0.13%), and Immigrants from Laos (90.5%, a difference of 0.18%).
| Demographics | Rating | Rank | 11th Grade |
| Barbadians | 0.0 /100 | #279 | Tragic 90.8% |
| Sri Lankans | 0.0 /100 | #280 | Tragic 90.7% |
| Dutch West Indians | 0.0 /100 | #281 | Tragic 90.7% |
| Immigrants | St. Vincent and the Grenadines | 0.0 /100 | #282 | Tragic 90.7% |
| Immigrants | Barbados | 0.0 /100 | #283 | Tragic 90.7% |
| Immigrants | Laos | 0.0 /100 | #284 | Tragic 90.5% |
| Immigrants | Burma/Myanmar | 0.0 /100 | #285 | Tragic 90.4% |
| Immigrants | West Indies | 0.0 /100 | #286 | Tragic 90.4% |
| Apache | 0.0 /100 | #287 | Tragic 90.4% |
| Pennsylvania Germans | 0.0 /100 | #288 | Tragic 90.3% |
| British West Indians | 0.0 /100 | #289 | Tragic 90.3% |
| Indonesians | 0.0 /100 | #290 | Tragic 90.3% |
| Haitians | 0.0 /100 | #291 | Tragic 90.3% |
| Cubans | 0.0 /100 | #292 | Tragic 90.2% |
| Natives/Alaskans | 0.0 /100 | #293 | Tragic 90.2% |
| Immigrants | Grenada | 0.0 /100 | #294 | Tragic 90.1% |
| Immigrants | Vietnam | 0.0 /100 | #295 | Tragic 90.0% |
| Fijians | 0.0 /100 | #296 | Tragic 90.0% |
| Navajo | 0.0 /100 | #297 | Tragic 90.0% |
| Immigrants | Fiji | 0.0 /100 | #298 | Tragic 89.9% |
| Japanese | 0.0 /100 | #299 | Tragic 89.9% |