Mexican vs Puget Sound Salish 11th Grade
COMPARE
Mexican
Puget Sound Salish
11th Grade
11th Grade Comparison
Mexicans
Puget Sound Salish
86.1%
11TH GRADE
0.0/ 100
METRIC RATING
341st/ 347
METRIC RANK
93.6%
11TH GRADE
99.1/ 100
METRIC RATING
93rd/ 347
METRIC RANK
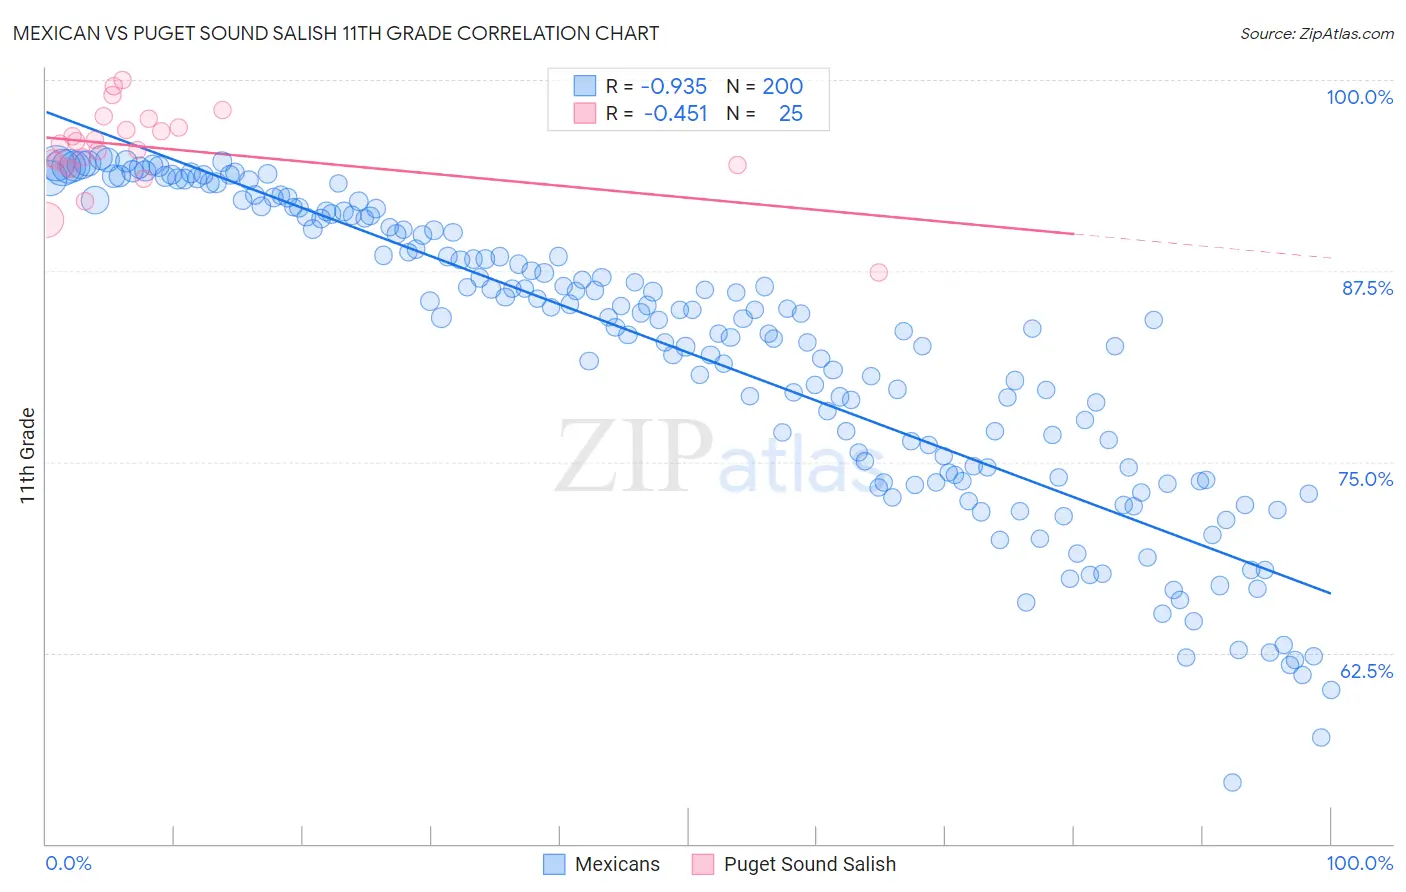
Mexican vs Puget Sound Salish 11th Grade Correlation Chart
The statistical analysis conducted on geographies consisting of 565,338,951 people shows a near-perfect negative correlation between the proportion of Mexicans and percentage of population with at least 11th grade education in the United States with a correlation coefficient (R) of -0.935 and weighted average of 86.1%. Similarly, the statistical analysis conducted on geographies consisting of 46,155,775 people shows a moderate negative correlation between the proportion of Puget Sound Salish and percentage of population with at least 11th grade education in the United States with a correlation coefficient (R) of -0.451 and weighted average of 93.6%, a difference of 8.7%.
11th Grade Correlation Summary
| Measurement | Mexican | Puget Sound Salish |
| Minimum | 54.0% | 87.4% |
| Maximum | 94.9% | 100.0% |
| Range | 40.9% | 12.6% |
| Mean | 82.1% | 95.5% |
| Median | 84.4% | 95.8% |
| Interquartile 25% (IQ1) | 74.2% | 94.4% |
| Interquartile 75% (IQ3) | 90.9% | 97.2% |
| Interquartile Range (IQR) | 16.7% | 2.8% |
| Standard Deviation (Sample) | 9.8% | 2.7% |
| Standard Deviation (Population) | 9.7% | 2.7% |
Similar Demographics by 11th Grade
Demographics Similar to Mexicans by 11th Grade
In terms of 11th grade, the demographic groups most similar to Mexicans are Salvadoran (86.2%, a difference of 0.060%), Guatemalan (86.4%, a difference of 0.29%), Immigrants from Guatemala (85.8%, a difference of 0.33%), Immigrants from Latin America (86.8%, a difference of 0.78%), and Immigrants from Dominican Republic (86.9%, a difference of 0.91%).
| Demographics | Rating | Rank | 11th Grade |
| Immigrants | Yemen | 0.0 /100 | #333 | Tragic 87.1% |
| Houma | 0.0 /100 | #334 | Tragic 87.0% |
| Central Americans | 0.0 /100 | #335 | Tragic 86.9% |
| Immigrants | Dominican Republic | 0.0 /100 | #336 | Tragic 86.9% |
| Immigrants | Honduras | 0.0 /100 | #337 | Tragic 86.9% |
| Immigrants | Latin America | 0.0 /100 | #338 | Tragic 86.8% |
| Guatemalans | 0.0 /100 | #339 | Tragic 86.4% |
| Salvadorans | 0.0 /100 | #340 | Tragic 86.2% |
| Mexicans | 0.0 /100 | #341 | Tragic 86.1% |
| Immigrants | Guatemala | 0.0 /100 | #342 | Tragic 85.8% |
| Immigrants | El Salvador | 0.0 /100 | #343 | Tragic 85.3% |
| Yakama | 0.0 /100 | #344 | Tragic 85.0% |
| Immigrants | Central America | 0.0 /100 | #345 | Tragic 84.9% |
| Spanish American Indians | 0.0 /100 | #346 | Tragic 84.7% |
| Immigrants | Mexico | 0.0 /100 | #347 | Tragic 84.5% |
Demographics Similar to Puget Sound Salish by 11th Grade
In terms of 11th grade, the demographic groups most similar to Puget Sound Salish are Immigrants from Bulgaria (93.6%, a difference of 0.020%), Swiss (93.6%, a difference of 0.020%), Immigrants from France (93.6%, a difference of 0.020%), South African (93.6%, a difference of 0.030%), and Ottawa (93.6%, a difference of 0.040%).
| Demographics | Rating | Rank | 11th Grade |
| Immigrants | South Central Asia | 99.2 /100 | #86 | Exceptional 93.6% |
| Immigrants | Western Europe | 99.2 /100 | #87 | Exceptional 93.6% |
| Cambodians | 99.2 /100 | #88 | Exceptional 93.6% |
| Burmese | 99.2 /100 | #89 | Exceptional 93.6% |
| Ottawa | 99.2 /100 | #90 | Exceptional 93.6% |
| South Africans | 99.2 /100 | #91 | Exceptional 93.6% |
| Immigrants | Bulgaria | 99.1 /100 | #92 | Exceptional 93.6% |
| Puget Sound Salish | 99.1 /100 | #93 | Exceptional 93.6% |
| Swiss | 99.0 /100 | #94 | Exceptional 93.6% |
| Immigrants | France | 99.0 /100 | #95 | Exceptional 93.6% |
| Immigrants | Turkey | 98.9 /100 | #96 | Exceptional 93.5% |
| Immigrants | Iran | 98.9 /100 | #97 | Exceptional 93.5% |
| Immigrants | Israel | 98.8 /100 | #98 | Exceptional 93.5% |
| Menominee | 98.7 /100 | #99 | Exceptional 93.5% |
| Immigrants | North Macedonia | 98.7 /100 | #100 | Exceptional 93.5% |