Immigrants from Iran vs Immigrants from Ukraine 8th Grade
COMPARE
Immigrants from Iran
Immigrants from Ukraine
8th Grade
8th Grade Comparison
Immigrants from Iran
Immigrants from Ukraine
95.8%
8TH GRADE
58.6/ 100
METRIC RATING
169th/ 347
METRIC RANK
95.8%
8TH GRADE
59.5/ 100
METRIC RATING
168th/ 347
METRIC RANK
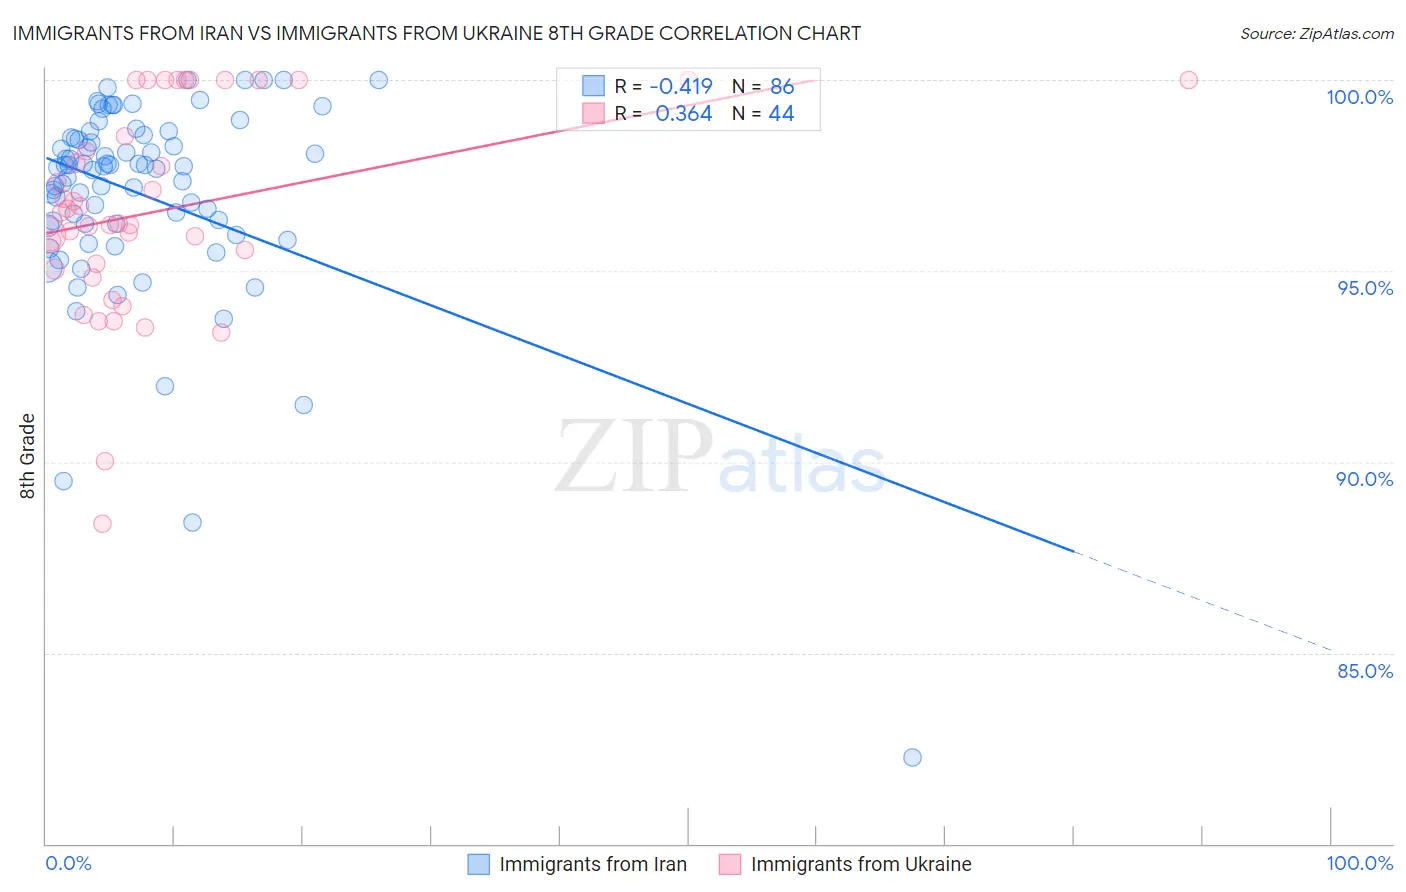
Immigrants from Iran vs Immigrants from Ukraine 8th Grade Correlation Chart
The statistical analysis conducted on geographies consisting of 279,867,553 people shows a moderate negative correlation between the proportion of Immigrants from Iran and percentage of population with at least 8th grade education in the United States with a correlation coefficient (R) of -0.419 and weighted average of 95.8%. Similarly, the statistical analysis conducted on geographies consisting of 289,712,791 people shows a mild positive correlation between the proportion of Immigrants from Ukraine and percentage of population with at least 8th grade education in the United States with a correlation coefficient (R) of 0.364 and weighted average of 95.8%, a difference of 0.010%.
8th Grade Correlation Summary
| Measurement | Immigrants from Iran | Immigrants from Ukraine |
| Minimum | 82.3% | 88.4% |
| Maximum | 100.0% | 100.0% |
| Range | 17.7% | 11.6% |
| Mean | 97.0% | 96.6% |
| Median | 97.7% | 96.4% |
| Interquartile 25% (IQ1) | 96.2% | 95.1% |
| Interquartile 75% (IQ3) | 98.5% | 99.3% |
| Interquartile Range (IQR) | 2.3% | 4.2% |
| Standard Deviation (Sample) | 2.7% | 2.7% |
| Standard Deviation (Population) | 2.7% | 2.7% |
Demographics Similar to Immigrants from Iran and Immigrants from Ukraine by 8th Grade
In terms of 8th grade, the demographic groups most similar to Immigrants from Iran are Ute (95.8%, a difference of 0.0%), Egyptian (95.8%, a difference of 0.0%), Immigrants from Korea (95.8%, a difference of 0.0%), Spaniard (95.8%, a difference of 0.010%), and Alsatian (95.8%, a difference of 0.020%). Similarly, the demographic groups most similar to Immigrants from Ukraine are Spaniard (95.8%, a difference of 0.0%), Alsatian (95.8%, a difference of 0.010%), Immigrants from Poland (95.8%, a difference of 0.010%), Ute (95.8%, a difference of 0.010%), and Egyptian (95.8%, a difference of 0.010%).
| Demographics | Rating | Rank | 8th Grade |
| Arabs | 69.4 /100 | #158 | Good 95.9% |
| Immigrants | Kazakhstan | 68.4 /100 | #159 | Good 95.9% |
| Seminole | 67.7 /100 | #160 | Good 95.8% |
| Bermudans | 67.5 /100 | #161 | Good 95.8% |
| Immigrants | Kenya | 67.2 /100 | #162 | Good 95.8% |
| Immigrants | Sri Lanka | 64.1 /100 | #163 | Good 95.8% |
| Immigrants | Italy | 63.5 /100 | #164 | Good 95.8% |
| Alsatians | 61.4 /100 | #165 | Good 95.8% |
| Immigrants | Poland | 61.1 /100 | #166 | Good 95.8% |
| Spaniards | 60.0 /100 | #167 | Good 95.8% |
| Immigrants | Ukraine | 59.5 /100 | #168 | Average 95.8% |
| Immigrants | Iran | 58.6 /100 | #169 | Average 95.8% |
| Ute | 58.5 /100 | #170 | Average 95.8% |
| Egyptians | 58.2 /100 | #171 | Average 95.8% |
| Immigrants | Korea | 57.9 /100 | #172 | Average 95.8% |
| Mongolians | 53.0 /100 | #173 | Average 95.8% |
| Chileans | 50.0 /100 | #174 | Average 95.7% |
| Immigrants | Albania | 49.6 /100 | #175 | Average 95.7% |
| Pakistanis | 48.8 /100 | #176 | Average 95.7% |
| Marshallese | 47.6 /100 | #177 | Average 95.7% |
| Venezuelans | 47.5 /100 | #178 | Average 95.7% |