Navajo vs Ethiopian Master's Degree
COMPARE
Navajo
Ethiopian
Master's Degree
Master's Degree Comparison
Navajo
Ethiopians
9.4%
MASTER'S DEGREE
0.0/ 100
METRIC RATING
341st/ 347
METRIC RANK
18.0%
MASTER'S DEGREE
99.8/ 100
METRIC RATING
66th/ 347
METRIC RANK
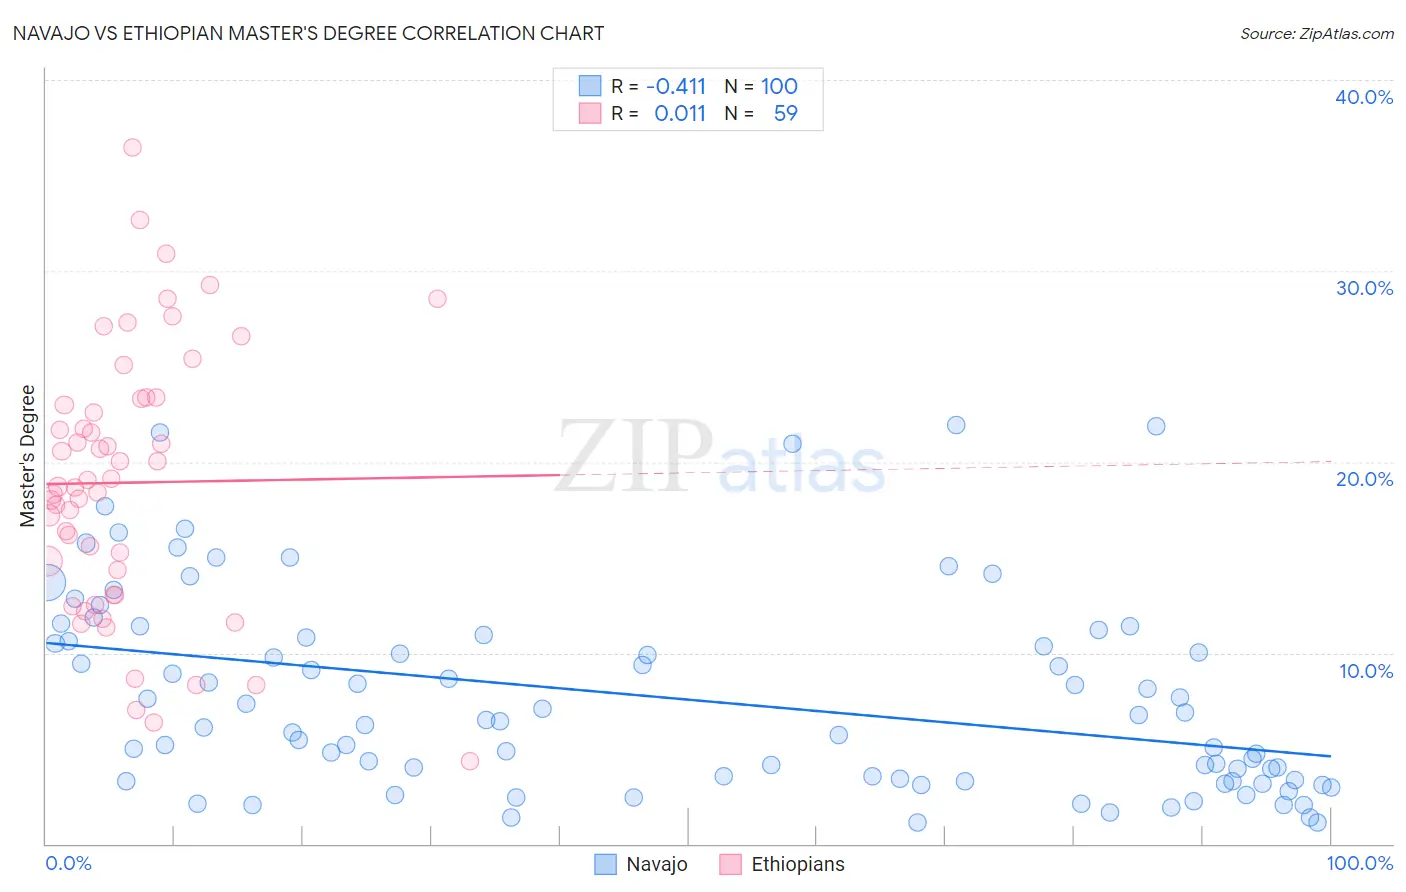
Navajo vs Ethiopian Master's Degree Correlation Chart
The statistical analysis conducted on geographies consisting of 224,762,496 people shows a moderate negative correlation between the proportion of Navajo and percentage of population with at least master's degree education in the United States with a correlation coefficient (R) of -0.411 and weighted average of 9.4%. Similarly, the statistical analysis conducted on geographies consisting of 223,155,116 people shows no correlation between the proportion of Ethiopians and percentage of population with at least master's degree education in the United States with a correlation coefficient (R) of 0.011 and weighted average of 18.0%, a difference of 90.6%.
Master's Degree Correlation Summary
| Measurement | Navajo | Ethiopian |
| Minimum | 1.1% | 4.3% |
| Maximum | 22.0% | 36.4% |
| Range | 20.9% | 32.1% |
| Mean | 7.6% | 18.9% |
| Median | 6.3% | 18.7% |
| Interquartile 25% (IQ1) | 3.3% | 13.1% |
| Interquartile 75% (IQ3) | 10.7% | 23.3% |
| Interquartile Range (IQR) | 7.4% | 10.2% |
| Standard Deviation (Sample) | 5.2% | 6.9% |
| Standard Deviation (Population) | 5.1% | 6.8% |
Similar Demographics by Master's Degree
Demographics Similar to Navajo by Master's Degree
In terms of master's degree, the demographic groups most similar to Navajo are Yakama (9.5%, a difference of 0.35%), Immigrants from Mexico (9.3%, a difference of 1.3%), Spanish American Indian (9.6%, a difference of 1.6%), Lumbee (9.3%, a difference of 1.8%), and Pima (9.2%, a difference of 1.9%).
| Demographics | Rating | Rank | Master's Degree |
| Menominee | 0.0 /100 | #333 | Tragic 10.2% |
| Arapaho | 0.0 /100 | #334 | Tragic 10.0% |
| Immigrants | Central America | 0.0 /100 | #335 | Tragic 10.0% |
| Natives/Alaskans | 0.0 /100 | #336 | Tragic 9.9% |
| Mexicans | 0.0 /100 | #337 | Tragic 9.7% |
| Tohono O'odham | 0.0 /100 | #338 | Tragic 9.7% |
| Spanish American Indians | 0.0 /100 | #339 | Tragic 9.6% |
| Yakama | 0.0 /100 | #340 | Tragic 9.5% |
| Navajo | 0.0 /100 | #341 | Tragic 9.4% |
| Immigrants | Mexico | 0.0 /100 | #342 | Tragic 9.3% |
| Lumbee | 0.0 /100 | #343 | Tragic 9.3% |
| Pima | 0.0 /100 | #344 | Tragic 9.2% |
| Yuman | 0.0 /100 | #345 | Tragic 9.2% |
| Yup'ik | 0.0 /100 | #346 | Tragic 8.5% |
| Houma | 0.0 /100 | #347 | Tragic 7.9% |
Demographics Similar to Ethiopians by Master's Degree
In terms of master's degree, the demographic groups most similar to Ethiopians are Immigrants from Kazakhstan (18.0%, a difference of 0.020%), Immigrants from Argentina (18.0%, a difference of 0.050%), Immigrants from Ethiopia (17.9%, a difference of 0.27%), Immigrants from Uzbekistan (17.9%, a difference of 0.60%), and South African (18.1%, a difference of 0.73%).
| Demographics | Rating | Rank | Master's Degree |
| Immigrants | Bulgaria | 99.9 /100 | #59 | Exceptional 18.3% |
| New Zealanders | 99.9 /100 | #60 | Exceptional 18.3% |
| Immigrants | Europe | 99.9 /100 | #61 | Exceptional 18.2% |
| Argentineans | 99.9 /100 | #62 | Exceptional 18.2% |
| Immigrants | Netherlands | 99.9 /100 | #63 | Exceptional 18.1% |
| South Africans | 99.9 /100 | #64 | Exceptional 18.1% |
| Immigrants | Kazakhstan | 99.8 /100 | #65 | Exceptional 18.0% |
| Ethiopians | 99.8 /100 | #66 | Exceptional 18.0% |
| Immigrants | Argentina | 99.8 /100 | #67 | Exceptional 18.0% |
| Immigrants | Ethiopia | 99.8 /100 | #68 | Exceptional 17.9% |
| Immigrants | Uzbekistan | 99.8 /100 | #69 | Exceptional 17.9% |
| Immigrants | Western Europe | 99.8 /100 | #70 | Exceptional 17.8% |
| Immigrants | Pakistan | 99.7 /100 | #71 | Exceptional 17.8% |
| Lithuanians | 99.7 /100 | #72 | Exceptional 17.7% |
| Zimbabweans | 99.7 /100 | #73 | Exceptional 17.7% |