French vs Immigrants from Albania 10th Grade
COMPARE
French
Immigrants from Albania
10th Grade
10th Grade Comparison
French
Immigrants from Albania
95.3%
10TH GRADE
100.0/ 100
METRIC RATING
33rd/ 347
METRIC RANK
93.8%
10TH GRADE
52.4/ 100
METRIC RATING
171st/ 347
METRIC RANK
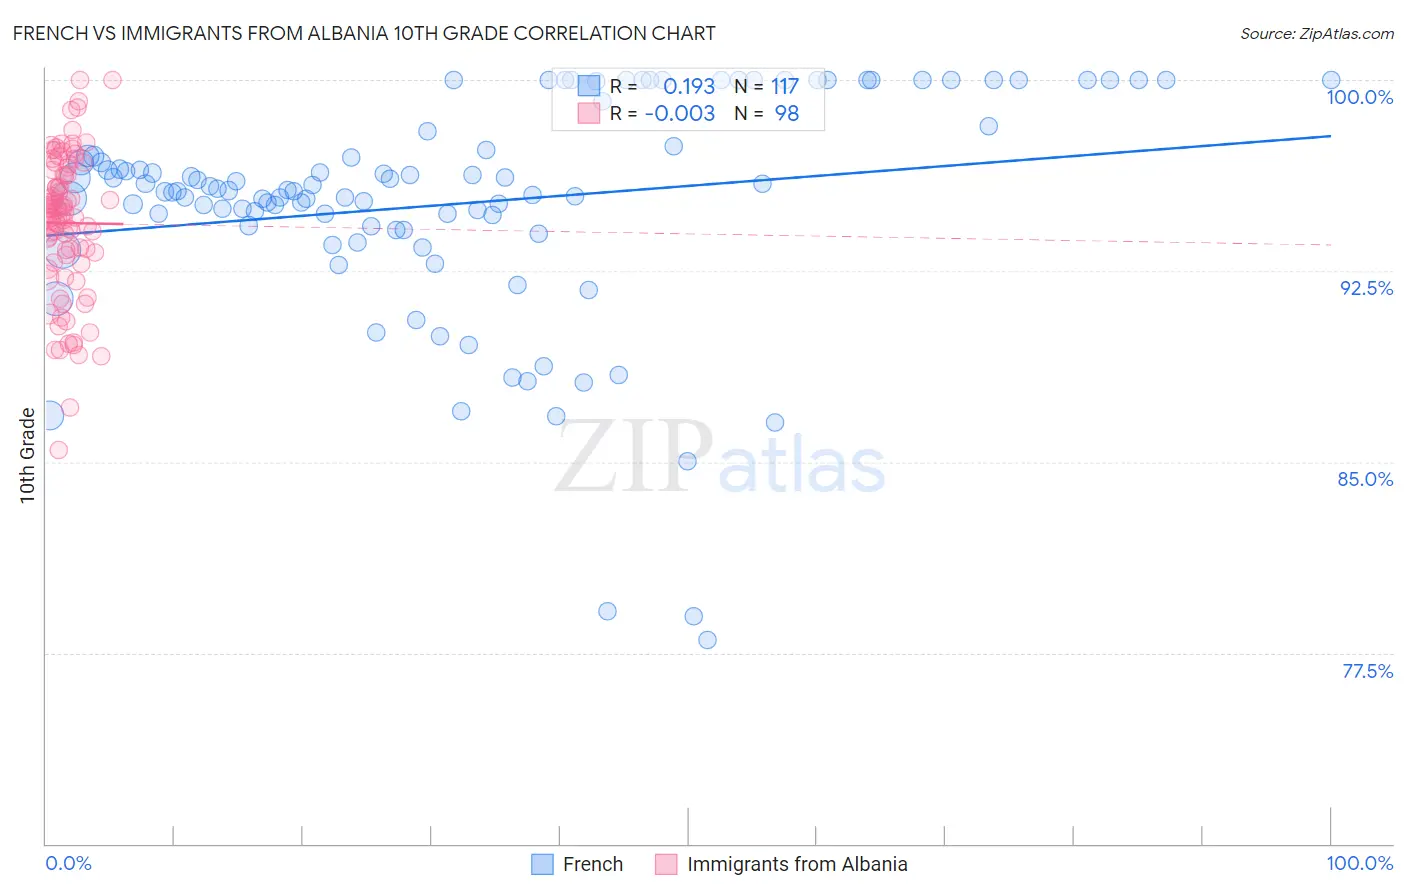
French vs Immigrants from Albania 10th Grade Correlation Chart
The statistical analysis conducted on geographies consisting of 572,427,496 people shows a poor positive correlation between the proportion of French and percentage of population with at least 10th grade education in the United States with a correlation coefficient (R) of 0.193 and weighted average of 95.3%. Similarly, the statistical analysis conducted on geographies consisting of 119,309,649 people shows no correlation between the proportion of Immigrants from Albania and percentage of population with at least 10th grade education in the United States with a correlation coefficient (R) of -0.003 and weighted average of 93.8%, a difference of 1.7%.
10th Grade Correlation Summary
| Measurement | French | Immigrants from Albania |
| Minimum | 78.0% | 85.5% |
| Maximum | 100.0% | 100.0% |
| Range | 22.0% | 14.5% |
| Mean | 95.1% | 94.4% |
| Median | 95.7% | 94.8% |
| Interquartile 25% (IQ1) | 94.2% | 93.1% |
| Interquartile 75% (IQ3) | 97.7% | 96.3% |
| Interquartile Range (IQR) | 3.5% | 3.1% |
| Standard Deviation (Sample) | 4.4% | 2.8% |
| Standard Deviation (Population) | 4.4% | 2.8% |
Similar Demographics by 10th Grade
Demographics Similar to French by 10th Grade
In terms of 10th grade, the demographic groups most similar to French are Iranian (95.3%, a difference of 0.0%), Hungarian (95.3%, a difference of 0.0%), British (95.3%, a difference of 0.010%), Estonian (95.3%, a difference of 0.020%), and Immigrants from India (95.3%, a difference of 0.020%).
| Demographics | Rating | Rank | 10th Grade |
| Welsh | 100.0 /100 | #26 | Exceptional 95.5% |
| Alaskan Athabascans | 100.0 /100 | #27 | Exceptional 95.4% |
| Luxembourgers | 100.0 /100 | #28 | Exceptional 95.4% |
| Bulgarians | 100.0 /100 | #29 | Exceptional 95.4% |
| Belgians | 100.0 /100 | #30 | Exceptional 95.4% |
| Iranians | 100.0 /100 | #31 | Exceptional 95.3% |
| Hungarians | 100.0 /100 | #32 | Exceptional 95.3% |
| French | 100.0 /100 | #33 | Exceptional 95.3% |
| British | 99.9 /100 | #34 | Exceptional 95.3% |
| Estonians | 99.9 /100 | #35 | Exceptional 95.3% |
| Immigrants | India | 99.9 /100 | #36 | Exceptional 95.3% |
| French Canadians | 99.9 /100 | #37 | Exceptional 95.3% |
| Northern Europeans | 99.9 /100 | #38 | Exceptional 95.3% |
| Immigrants | Scotland | 99.9 /100 | #39 | Exceptional 95.2% |
| Scotch-Irish | 99.9 /100 | #40 | Exceptional 95.2% |
Demographics Similar to Immigrants from Albania by 10th Grade
In terms of 10th grade, the demographic groups most similar to Immigrants from Albania are Immigrants from Venezuela (93.8%, a difference of 0.010%), French American Indian (93.7%, a difference of 0.010%), Spaniard (93.7%, a difference of 0.020%), Argentinean (93.7%, a difference of 0.020%), and Immigrants from Nepal (93.7%, a difference of 0.020%).
| Demographics | Rating | Rank | 10th Grade |
| Iraqis | 68.1 /100 | #164 | Good 93.9% |
| Brazilians | 63.6 /100 | #165 | Good 93.8% |
| Immigrants | Iraq | 63.0 /100 | #166 | Good 93.8% |
| Immigrants | Egypt | 62.3 /100 | #167 | Good 93.8% |
| Alsatians | 59.4 /100 | #168 | Average 93.8% |
| Immigrants | Spain | 55.9 /100 | #169 | Average 93.8% |
| Immigrants | Venezuela | 53.9 /100 | #170 | Average 93.8% |
| Immigrants | Albania | 52.4 /100 | #171 | Average 93.8% |
| French American Indians | 50.9 /100 | #172 | Average 93.7% |
| Spaniards | 50.3 /100 | #173 | Average 93.7% |
| Argentineans | 50.0 /100 | #174 | Average 93.7% |
| Immigrants | Nepal | 49.6 /100 | #175 | Average 93.7% |
| Immigrants | Argentina | 47.1 /100 | #176 | Average 93.7% |
| Immigrants | Lebanon | 47.1 /100 | #177 | Average 93.7% |
| Sierra Leoneans | 46.1 /100 | #178 | Average 93.7% |