Choctaw vs Carpatho Rusyn GED/Equivalency
COMPARE
Choctaw
Carpatho Rusyn
GED/Equivalency
GED/Equivalency Comparison
Choctaw
Carpatho Rusyns
83.1%
GED/EQUIVALENCY
0.3/ 100
METRIC RATING
260th/ 347
METRIC RANK
89.1%
GED/EQUIVALENCY
99.9/ 100
METRIC RATING
8th/ 347
METRIC RANK
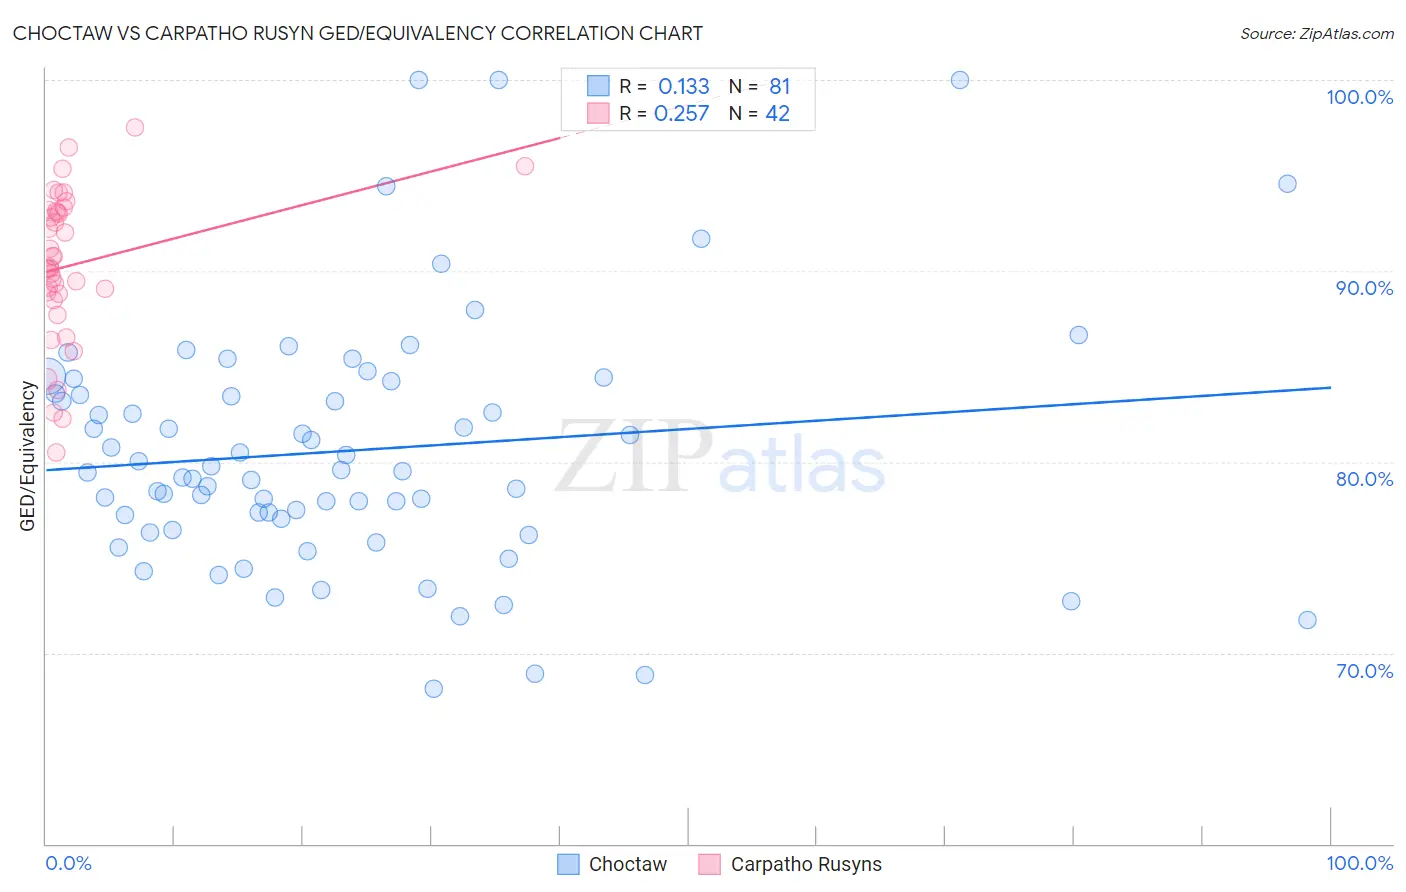
Choctaw vs Carpatho Rusyn GED/Equivalency Correlation Chart
The statistical analysis conducted on geographies consisting of 269,738,650 people shows a poor positive correlation between the proportion of Choctaw and percentage of population with at least ged/equivalency education in the United States with a correlation coefficient (R) of 0.133 and weighted average of 83.1%. Similarly, the statistical analysis conducted on geographies consisting of 58,871,690 people shows a weak positive correlation between the proportion of Carpatho Rusyns and percentage of population with at least ged/equivalency education in the United States with a correlation coefficient (R) of 0.257 and weighted average of 89.1%, a difference of 7.1%.
GED/Equivalency Correlation Summary
| Measurement | Choctaw | Carpatho Rusyn |
| Minimum | 68.1% | 80.5% |
| Maximum | 100.0% | 97.5% |
| Range | 31.9% | 17.0% |
| Mean | 80.6% | 90.3% |
| Median | 79.5% | 90.2% |
| Interquartile 25% (IQ1) | 76.7% | 88.8% |
| Interquartile 75% (IQ3) | 83.9% | 93.2% |
| Interquartile Range (IQR) | 7.2% | 4.3% |
| Standard Deviation (Sample) | 6.5% | 3.9% |
| Standard Deviation (Population) | 6.5% | 3.9% |
Similar Demographics by GED/Equivalency
Demographics Similar to Choctaw by GED/Equivalency
In terms of ged/equivalency, the demographic groups most similar to Choctaw are Immigrants from Vietnam (83.2%, a difference of 0.030%), Inupiat (83.1%, a difference of 0.050%), Immigrants from Armenia (83.1%, a difference of 0.060%), Immigrants from Congo (83.1%, a difference of 0.070%), and Bangladeshi (83.1%, a difference of 0.080%).
| Demographics | Rating | Rank | GED/Equivalency |
| Comanche | 0.7 /100 | #253 | Tragic 83.6% |
| Creek | 0.7 /100 | #254 | Tragic 83.6% |
| Colville | 0.5 /100 | #255 | Tragic 83.4% |
| Africans | 0.5 /100 | #256 | Tragic 83.4% |
| Jamaicans | 0.4 /100 | #257 | Tragic 83.3% |
| Malaysians | 0.4 /100 | #258 | Tragic 83.3% |
| Immigrants | Vietnam | 0.3 /100 | #259 | Tragic 83.2% |
| Choctaw | 0.3 /100 | #260 | Tragic 83.1% |
| Inupiat | 0.2 /100 | #261 | Tragic 83.1% |
| Immigrants | Armenia | 0.2 /100 | #262 | Tragic 83.1% |
| Immigrants | Congo | 0.2 /100 | #263 | Tragic 83.1% |
| Bangladeshis | 0.2 /100 | #264 | Tragic 83.1% |
| West Indians | 0.2 /100 | #265 | Tragic 83.1% |
| Kiowa | 0.2 /100 | #266 | Tragic 83.1% |
| Trinidadians and Tobagonians | 0.2 /100 | #267 | Tragic 83.0% |
Demographics Similar to Carpatho Rusyns by GED/Equivalency
In terms of ged/equivalency, the demographic groups most similar to Carpatho Rusyns are Chinese (89.0%, a difference of 0.020%), Eastern European (89.1%, a difference of 0.050%), Norwegian (89.0%, a difference of 0.070%), Thai (89.1%, a difference of 0.090%), and Bulgarian (89.0%, a difference of 0.10%).
| Demographics | Rating | Rank | GED/Equivalency |
| Immigrants | India | 100.0 /100 | #1 | Exceptional 89.7% |
| Filipinos | 100.0 /100 | #2 | Exceptional 89.5% |
| Immigrants | Singapore | 100.0 /100 | #3 | Exceptional 89.3% |
| Iranians | 100.0 /100 | #4 | Exceptional 89.2% |
| Latvians | 100.0 /100 | #5 | Exceptional 89.2% |
| Thais | 100.0 /100 | #6 | Exceptional 89.1% |
| Eastern Europeans | 99.9 /100 | #7 | Exceptional 89.1% |
| Carpatho Rusyns | 99.9 /100 | #8 | Exceptional 89.1% |
| Chinese | 99.9 /100 | #9 | Exceptional 89.0% |
| Norwegians | 99.9 /100 | #10 | Exceptional 89.0% |
| Bulgarians | 99.9 /100 | #11 | Exceptional 89.0% |
| Lithuanians | 99.9 /100 | #12 | Exceptional 88.9% |
| Immigrants | Iran | 99.9 /100 | #13 | Exceptional 88.9% |
| Cypriots | 99.9 /100 | #14 | Exceptional 88.9% |
| Okinawans | 99.9 /100 | #15 | Exceptional 88.9% |