Immigrants from Guyana vs Lithuanian 4th Grade
COMPARE
Immigrants from Guyana
Lithuanian
4th Grade
4th Grade Comparison
Immigrants from Guyana
Lithuanians
96.3%
4TH GRADE
0.0/ 100
METRIC RATING
309th/ 347
METRIC RANK
98.3%
4TH GRADE
100.0/ 100
METRIC RATING
21st/ 347
METRIC RANK
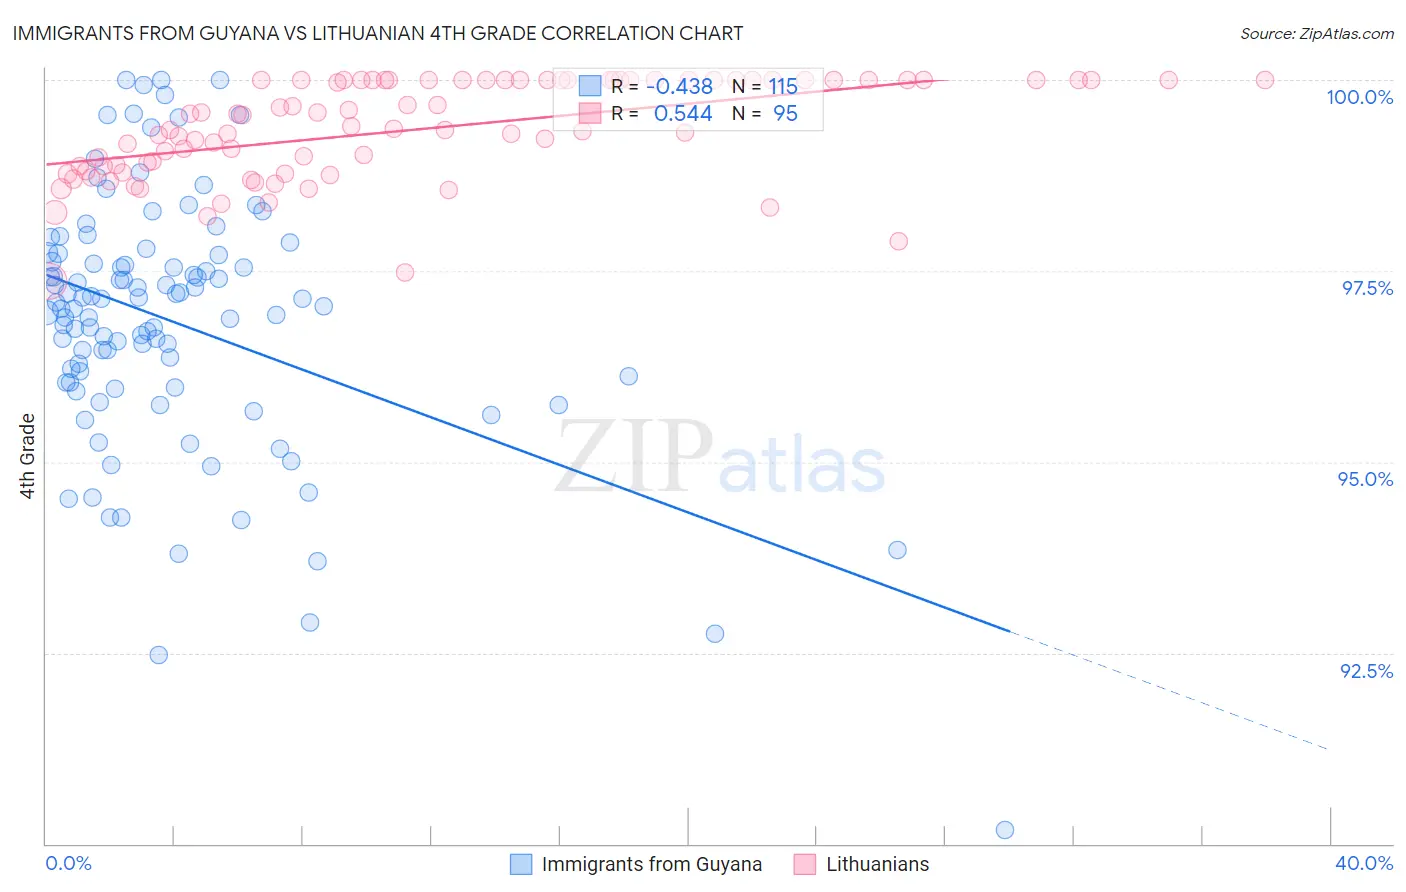
Immigrants from Guyana vs Lithuanian 4th Grade Correlation Chart
The statistical analysis conducted on geographies consisting of 183,673,461 people shows a moderate negative correlation between the proportion of Immigrants from Guyana and percentage of population with at least 4th grade education in the United States with a correlation coefficient (R) of -0.438 and weighted average of 96.3%. Similarly, the statistical analysis conducted on geographies consisting of 421,946,231 people shows a substantial positive correlation between the proportion of Lithuanians and percentage of population with at least 4th grade education in the United States with a correlation coefficient (R) of 0.544 and weighted average of 98.3%, a difference of 2.1%.
4th Grade Correlation Summary
| Measurement | Immigrants from Guyana | Lithuanian |
| Minimum | 90.2% | 97.4% |
| Maximum | 100.0% | 100.0% |
| Range | 9.8% | 2.6% |
| Mean | 96.8% | 99.3% |
| Median | 97.0% | 99.4% |
| Interquartile 25% (IQ1) | 96.0% | 98.8% |
| Interquartile 75% (IQ3) | 97.7% | 100.0% |
| Interquartile Range (IQR) | 1.7% | 1.2% |
| Standard Deviation (Sample) | 1.7% | 0.65% |
| Standard Deviation (Population) | 1.7% | 0.65% |
Similar Demographics by 4th Grade
Demographics Similar to Immigrants from Guyana by 4th Grade
In terms of 4th grade, the demographic groups most similar to Immigrants from Guyana are Immigrants from Laos (96.3%, a difference of 0.0%), Immigrants from Haiti (96.3%, a difference of 0.010%), Immigrants from Burma/Myanmar (96.3%, a difference of 0.020%), Sri Lankan (96.4%, a difference of 0.040%), and Immigrants from Caribbean (96.4%, a difference of 0.050%).
| Demographics | Rating | Rank | 4th Grade |
| Immigrants | Cuba | 0.0 /100 | #302 | Tragic 96.4% |
| Guyanese | 0.0 /100 | #303 | Tragic 96.4% |
| Ecuadorians | 0.0 /100 | #304 | Tragic 96.4% |
| Immigrants | Caribbean | 0.0 /100 | #305 | Tragic 96.4% |
| Sri Lankans | 0.0 /100 | #306 | Tragic 96.4% |
| Immigrants | Haiti | 0.0 /100 | #307 | Tragic 96.3% |
| Immigrants | Laos | 0.0 /100 | #308 | Tragic 96.3% |
| Immigrants | Guyana | 0.0 /100 | #309 | Tragic 96.3% |
| Immigrants | Burma/Myanmar | 0.0 /100 | #310 | Tragic 96.3% |
| Immigrants | Bangladesh | 0.0 /100 | #311 | Tragic 96.2% |
| Cape Verdeans | 0.0 /100 | #312 | Tragic 96.2% |
| Indonesians | 0.0 /100 | #313 | Tragic 96.2% |
| Vietnamese | 0.0 /100 | #314 | Tragic 96.2% |
| Nicaraguans | 0.0 /100 | #315 | Tragic 96.2% |
| Immigrants | Ecuador | 0.0 /100 | #316 | Tragic 96.2% |
Demographics Similar to Lithuanians by 4th Grade
In terms of 4th grade, the demographic groups most similar to Lithuanians are Finnish (98.3%, a difference of 0.0%), Irish (98.4%, a difference of 0.010%), Alaska Native (98.4%, a difference of 0.010%), Polish (98.4%, a difference of 0.020%), and Sioux (98.3%, a difference of 0.020%).
| Demographics | Rating | Rank | 4th Grade |
| Carpatho Rusyns | 100.0 /100 | #14 | Exceptional 98.4% |
| Dutch | 100.0 /100 | #15 | Exceptional 98.4% |
| Scottish | 100.0 /100 | #16 | Exceptional 98.4% |
| Pennsylvania Germans | 100.0 /100 | #17 | Exceptional 98.4% |
| Poles | 100.0 /100 | #18 | Exceptional 98.4% |
| Irish | 100.0 /100 | #19 | Exceptional 98.4% |
| Alaska Natives | 100.0 /100 | #20 | Exceptional 98.4% |
| Lithuanians | 100.0 /100 | #21 | Exceptional 98.3% |
| Finns | 100.0 /100 | #22 | Exceptional 98.3% |
| Sioux | 100.0 /100 | #23 | Exceptional 98.3% |
| Danes | 100.0 /100 | #24 | Exceptional 98.3% |
| Scotch-Irish | 100.0 /100 | #25 | Exceptional 98.3% |
| Croatians | 100.0 /100 | #26 | Exceptional 98.3% |
| French Canadians | 100.0 /100 | #27 | Exceptional 98.3% |
| French | 100.0 /100 | #28 | Exceptional 98.3% |