Immigrants from Belarus vs Immigrants from Hungary College, Under 1 year
COMPARE
Immigrants from Belarus
Immigrants from Hungary
College, Under 1 year
College, Under 1 year Comparison
Immigrants from Belarus
Immigrants from Hungary
69.2%
COLLEGE, UNDER 1 YEAR
99.5/ 100
METRIC RATING
62nd/ 347
METRIC RANK
68.3%
COLLEGE, UNDER 1 YEAR
98.3/ 100
METRIC RATING
84th/ 347
METRIC RANK
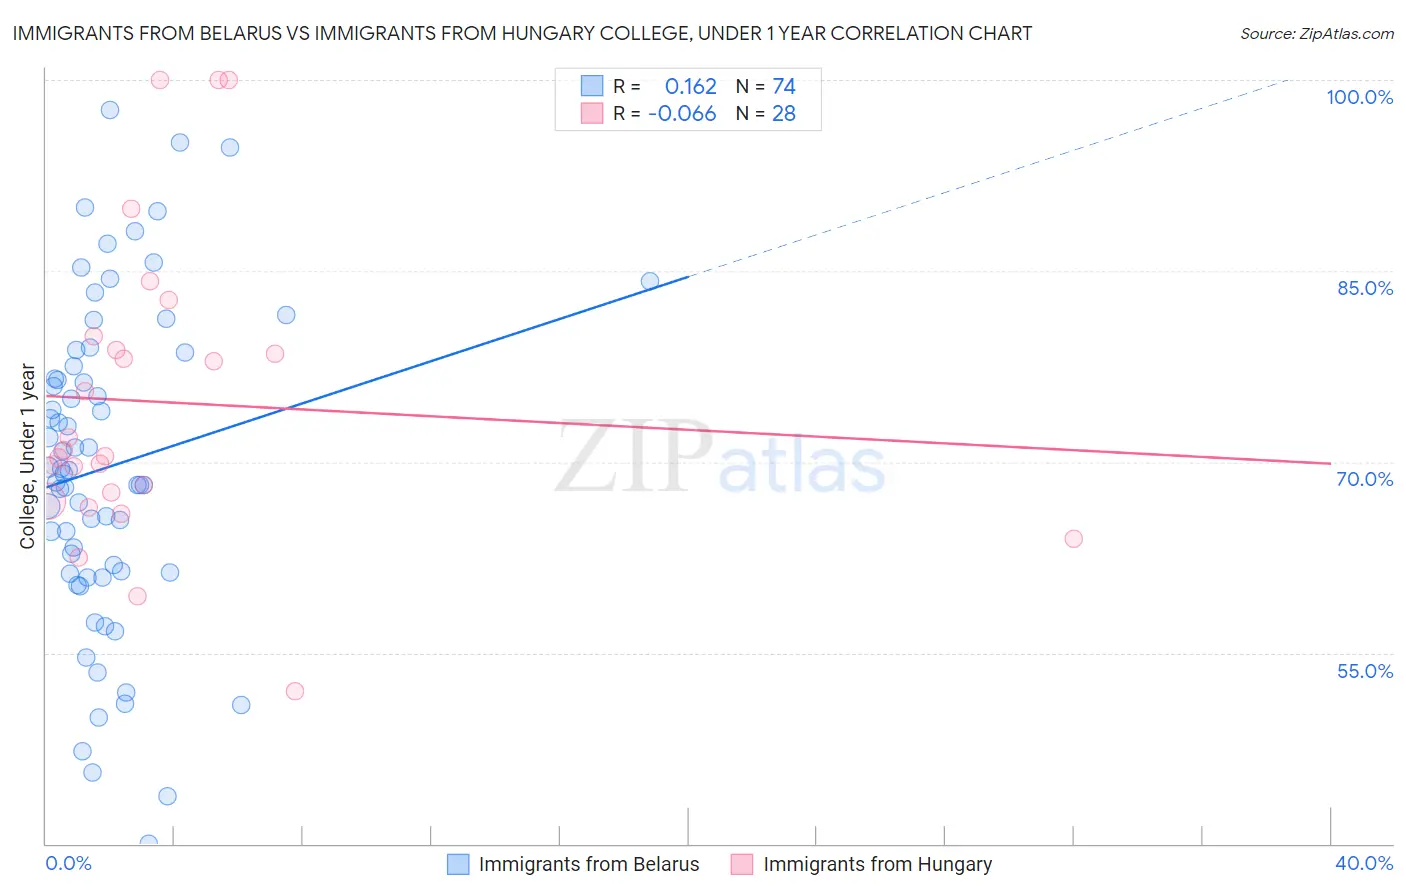
Immigrants from Belarus vs Immigrants from Hungary College, Under 1 year Correlation Chart
The statistical analysis conducted on geographies consisting of 150,205,158 people shows a poor positive correlation between the proportion of Immigrants from Belarus and percentage of population with at least college, under 1 year education in the United States with a correlation coefficient (R) of 0.162 and weighted average of 69.2%. Similarly, the statistical analysis conducted on geographies consisting of 195,707,305 people shows a slight negative correlation between the proportion of Immigrants from Hungary and percentage of population with at least college, under 1 year education in the United States with a correlation coefficient (R) of -0.066 and weighted average of 68.3%, a difference of 1.2%.
College, Under 1 year Correlation Summary
| Measurement | Immigrants from Belarus | Immigrants from Hungary |
| Minimum | 40.0% | 52.0% |
| Maximum | 97.7% | 100.0% |
| Range | 57.6% | 48.0% |
| Mean | 69.6% | 74.7% |
| Median | 69.2% | 70.7% |
| Interquartile 25% (IQ1) | 61.3% | 67.3% |
| Interquartile 75% (IQ3) | 77.5% | 79.3% |
| Interquartile Range (IQR) | 16.2% | 12.1% |
| Standard Deviation (Sample) | 12.6% | 11.9% |
| Standard Deviation (Population) | 12.5% | 11.7% |
Similar Demographics by College, Under 1 year
Demographics Similar to Immigrants from Belarus by College, Under 1 year
In terms of college, under 1 year, the demographic groups most similar to Immigrants from Belarus are Immigrants from Kazakhstan (69.2%, a difference of 0.0%), Immigrants from Asia (69.2%, a difference of 0.040%), Immigrants from Serbia (69.3%, a difference of 0.13%), Immigrants from Canada (69.1%, a difference of 0.13%), and Northern European (69.0%, a difference of 0.17%).
| Demographics | Rating | Rank | College, Under 1 year |
| Maltese | 99.7 /100 | #55 | Exceptional 69.5% |
| Immigrants | Scotland | 99.6 /100 | #56 | Exceptional 69.4% |
| Asians | 99.6 /100 | #57 | Exceptional 69.4% |
| Immigrants | Malaysia | 99.6 /100 | #58 | Exceptional 69.3% |
| Immigrants | Serbia | 99.5 /100 | #59 | Exceptional 69.3% |
| Immigrants | Asia | 99.5 /100 | #60 | Exceptional 69.2% |
| Immigrants | Kazakhstan | 99.5 /100 | #61 | Exceptional 69.2% |
| Immigrants | Belarus | 99.5 /100 | #62 | Exceptional 69.2% |
| Immigrants | Canada | 99.4 /100 | #63 | Exceptional 69.1% |
| Northern Europeans | 99.4 /100 | #64 | Exceptional 69.0% |
| Immigrants | Moldova | 99.3 /100 | #65 | Exceptional 69.0% |
| Immigrants | North America | 99.3 /100 | #66 | Exceptional 69.0% |
| Immigrants | Zimbabwe | 99.2 /100 | #67 | Exceptional 68.9% |
| Immigrants | Indonesia | 99.2 /100 | #68 | Exceptional 68.9% |
| Immigrants | Romania | 99.2 /100 | #69 | Exceptional 68.9% |
Demographics Similar to Immigrants from Hungary by College, Under 1 year
In terms of college, under 1 year, the demographic groups most similar to Immigrants from Hungary are Egyptian (68.3%, a difference of 0.010%), Immigrants from Lebanon (68.3%, a difference of 0.010%), Argentinean (68.4%, a difference of 0.020%), Chinese (68.3%, a difference of 0.030%), and Norwegian (68.4%, a difference of 0.040%).
| Demographics | Rating | Rank | College, Under 1 year |
| British | 98.6 /100 | #77 | Exceptional 68.5% |
| Danes | 98.6 /100 | #78 | Exceptional 68.5% |
| Greeks | 98.6 /100 | #79 | Exceptional 68.5% |
| Immigrants | Spain | 98.5 /100 | #80 | Exceptional 68.4% |
| Immigrants | Greece | 98.5 /100 | #81 | Exceptional 68.4% |
| Norwegians | 98.4 /100 | #82 | Exceptional 68.4% |
| Argentineans | 98.4 /100 | #83 | Exceptional 68.4% |
| Immigrants | Hungary | 98.3 /100 | #84 | Exceptional 68.3% |
| Egyptians | 98.3 /100 | #85 | Exceptional 68.3% |
| Immigrants | Lebanon | 98.3 /100 | #86 | Exceptional 68.3% |
| Chinese | 98.3 /100 | #87 | Exceptional 68.3% |
| Croatians | 98.2 /100 | #88 | Exceptional 68.3% |
| Ethiopians | 98.2 /100 | #89 | Exceptional 68.3% |
| Icelanders | 98.1 /100 | #90 | Exceptional 68.3% |
| Europeans | 98.1 /100 | #91 | Exceptional 68.2% |