Cherokee vs Immigrants from Greece 10th Grade
COMPARE
Cherokee
Immigrants from Greece
10th Grade
10th Grade Comparison
Cherokee
Immigrants from Greece
94.1%
10TH GRADE
84.9/ 100
METRIC RATING
143rd/ 347
METRIC RANK
94.3%
10TH GRADE
92.7/ 100
METRIC RATING
130th/ 347
METRIC RANK
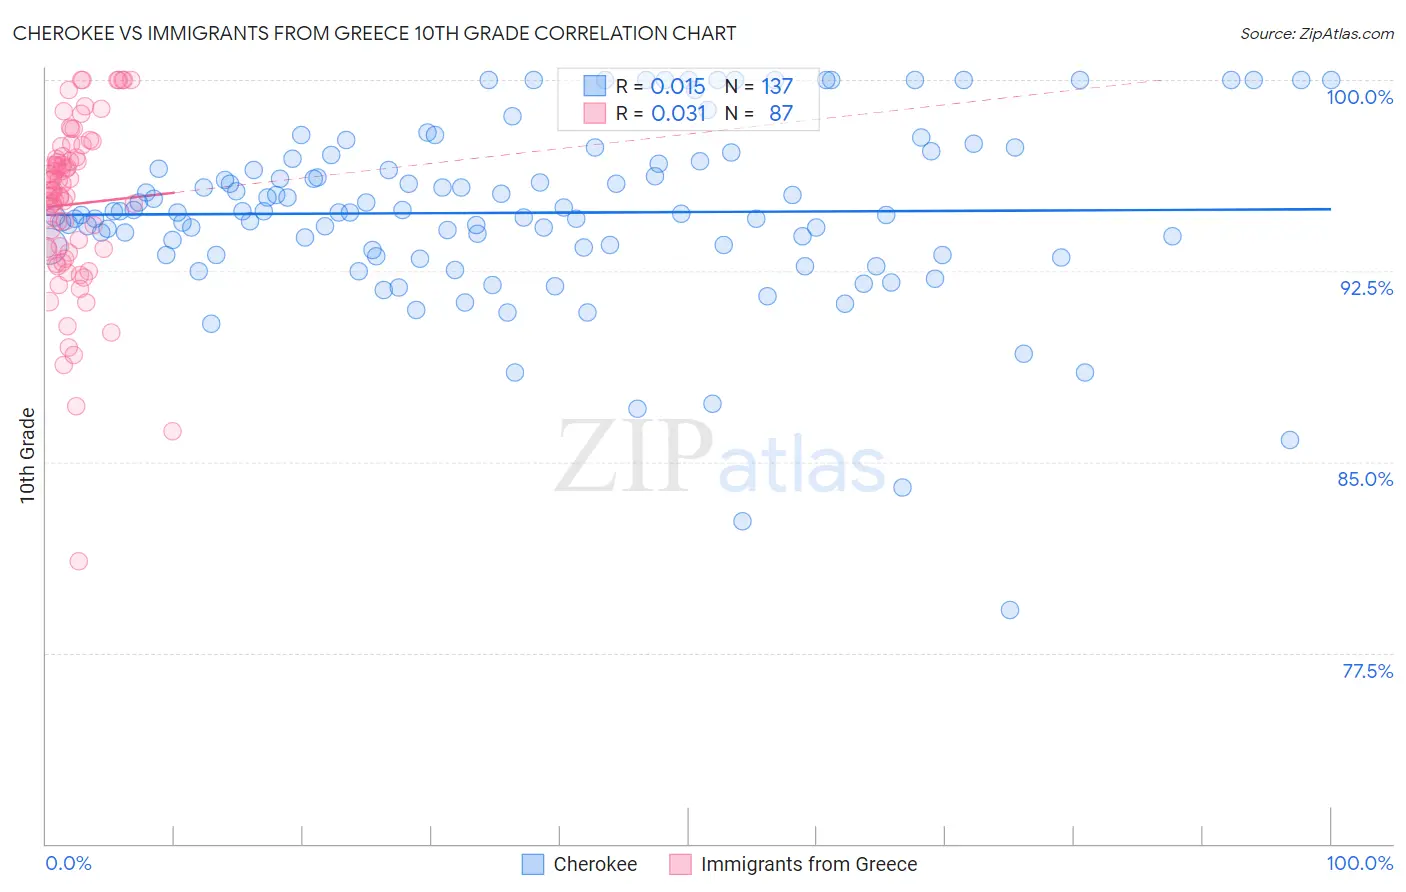
Cherokee vs Immigrants from Greece 10th Grade Correlation Chart
The statistical analysis conducted on geographies consisting of 493,720,058 people shows no correlation between the proportion of Cherokee and percentage of population with at least 10th grade education in the United States with a correlation coefficient (R) of 0.015 and weighted average of 94.1%. Similarly, the statistical analysis conducted on geographies consisting of 216,879,847 people shows no correlation between the proportion of Immigrants from Greece and percentage of population with at least 10th grade education in the United States with a correlation coefficient (R) of 0.031 and weighted average of 94.3%, a difference of 0.18%.
10th Grade Correlation Summary
| Measurement | Cherokee | Immigrants from Greece |
| Minimum | 79.2% | 81.1% |
| Maximum | 100.0% | 100.0% |
| Range | 20.8% | 18.9% |
| Mean | 94.8% | 95.1% |
| Median | 94.8% | 95.6% |
| Interquartile 25% (IQ1) | 93.2% | 93.3% |
| Interquartile 75% (IQ3) | 96.8% | 97.0% |
| Interquartile Range (IQR) | 3.6% | 3.7% |
| Standard Deviation (Sample) | 3.5% | 3.3% |
| Standard Deviation (Population) | 3.5% | 3.3% |
Demographics Similar to Cherokee and Immigrants from Greece by 10th Grade
In terms of 10th grade, the demographic groups most similar to Cherokee are Immigrants from Kazakhstan (94.1%, a difference of 0.0%), Nonimmigrants (94.1%, a difference of 0.020%), Hmong (94.1%, a difference of 0.030%), Albanian (94.1%, a difference of 0.030%), and Chickasaw (94.1%, a difference of 0.040%). Similarly, the demographic groups most similar to Immigrants from Greece are Iroquois (94.3%, a difference of 0.0%), Immigrants from Eastern Europe (94.3%, a difference of 0.010%), Immigrants from Russia (94.3%, a difference of 0.010%), Potawatomi (94.3%, a difference of 0.030%), and Creek (94.2%, a difference of 0.030%).
| Demographics | Rating | Rank | 10th Grade |
| Immigrants | Iran | 94.4 /100 | #126 | Exceptional 94.3% |
| Israelis | 93.8 /100 | #127 | Exceptional 94.3% |
| Potawatomi | 93.6 /100 | #128 | Exceptional 94.3% |
| Iroquois | 92.8 /100 | #129 | Exceptional 94.3% |
| Immigrants | Greece | 92.7 /100 | #130 | Exceptional 94.3% |
| Immigrants | Eastern Europe | 92.5 /100 | #131 | Exceptional 94.3% |
| Immigrants | Russia | 92.4 /100 | #132 | Exceptional 94.3% |
| Creek | 91.9 /100 | #133 | Exceptional 94.2% |
| Osage | 91.7 /100 | #134 | Exceptional 94.2% |
| Immigrants | Korea | 91.3 /100 | #135 | Exceptional 94.2% |
| Shoshone | 90.8 /100 | #136 | Exceptional 94.2% |
| Arapaho | 90.5 /100 | #137 | Exceptional 94.2% |
| Immigrants | Sri Lanka | 89.9 /100 | #138 | Excellent 94.2% |
| Immigrants | Bosnia and Herzegovina | 89.4 /100 | #139 | Excellent 94.2% |
| Immigrants | Jordan | 87.6 /100 | #140 | Excellent 94.1% |
| Hmong | 86.6 /100 | #141 | Excellent 94.1% |
| Albanians | 86.5 /100 | #142 | Excellent 94.1% |
| Cherokee | 84.9 /100 | #143 | Excellent 94.1% |
| Immigrants | Kazakhstan | 84.9 /100 | #144 | Excellent 94.1% |
| Immigrants | Nonimmigrants | 83.8 /100 | #145 | Excellent 94.1% |
| Chickasaw | 82.6 /100 | #146 | Excellent 94.1% |