Immigrants from Taiwan vs Cambodian 12th Grade, No Diploma
COMPARE
Immigrants from Taiwan
Cambodian
12th Grade, No Diploma
12th Grade, No Diploma Comparison
Immigrants from Taiwan
Cambodians
92.8%
12TH GRADE, NO DIPLOMA
99.7/ 100
METRIC RATING
58th/ 347
METRIC RANK
92.6%
12TH GRADE, NO DIPLOMA
99.3/ 100
METRIC RATING
78th/ 347
METRIC RANK
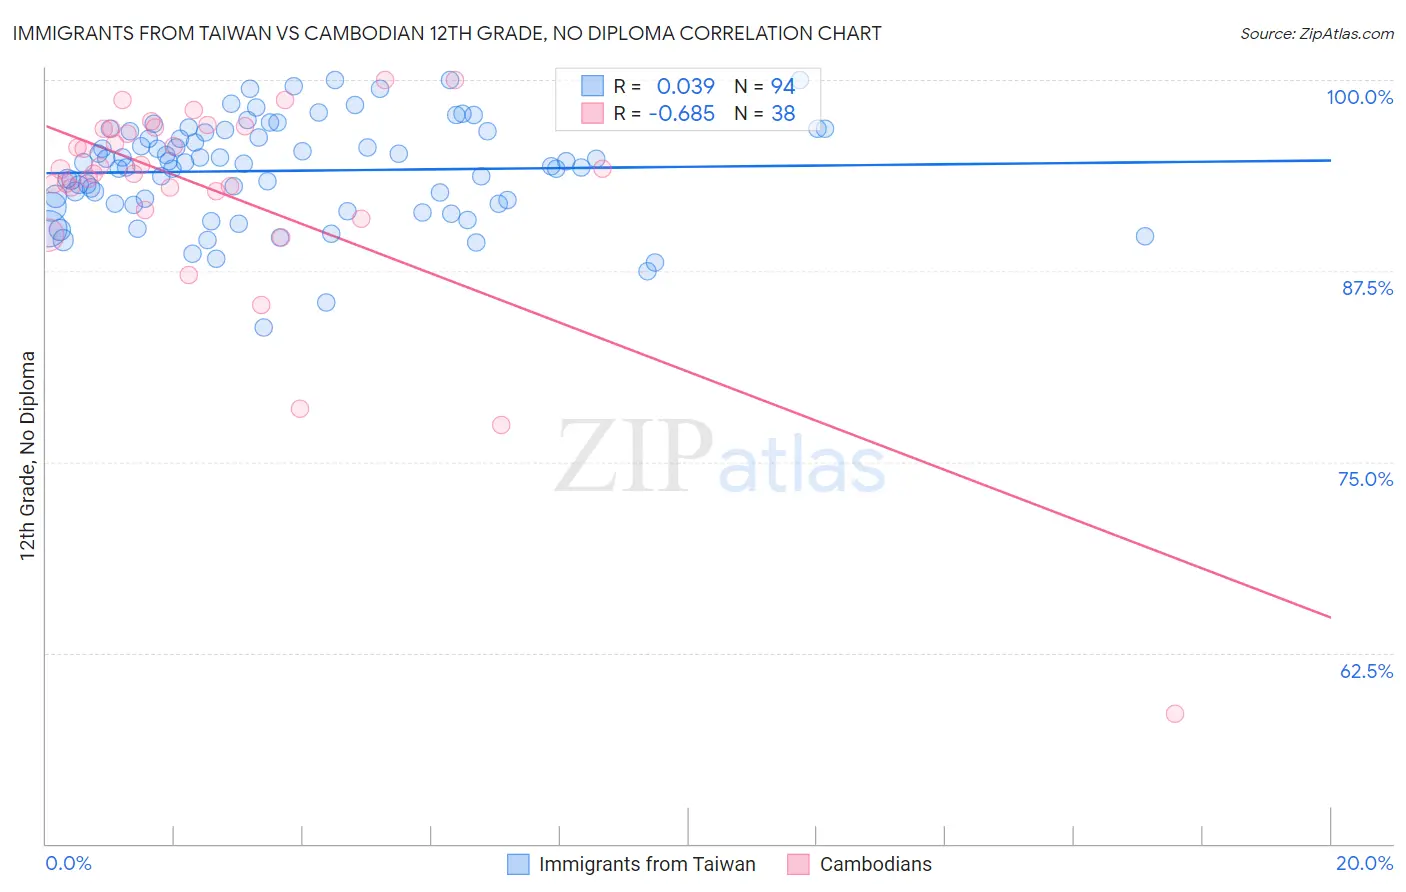
Immigrants from Taiwan vs Cambodian 12th Grade, No Diploma Correlation Chart
The statistical analysis conducted on geographies consisting of 298,119,887 people shows no correlation between the proportion of Immigrants from Taiwan and percentage of population with at least 12th grade (no diploma) education in the United States with a correlation coefficient (R) of 0.039 and weighted average of 92.8%. Similarly, the statistical analysis conducted on geographies consisting of 102,514,976 people shows a significant negative correlation between the proportion of Cambodians and percentage of population with at least 12th grade (no diploma) education in the United States with a correlation coefficient (R) of -0.685 and weighted average of 92.6%, a difference of 0.24%.
12th Grade, No Diploma Correlation Summary
| Measurement | Immigrants from Taiwan | Cambodian |
| Minimum | 83.8% | 58.5% |
| Maximum | 100.0% | 100.0% |
| Range | 16.2% | 41.5% |
| Mean | 94.1% | 92.7% |
| Median | 94.6% | 94.2% |
| Interquartile 25% (IQ1) | 91.9% | 92.8% |
| Interquartile 75% (IQ3) | 96.6% | 96.8% |
| Interquartile Range (IQR) | 4.7% | 4.0% |
| Standard Deviation (Sample) | 3.3% | 7.5% |
| Standard Deviation (Population) | 3.3% | 7.4% |
Demographics Similar to Immigrants from Taiwan and Cambodians by 12th Grade, No Diploma
In terms of 12th grade, no diploma, the demographic groups most similar to Immigrants from Taiwan are Immigrants from North America (92.8%, a difference of 0.010%), Slavic (92.8%, a difference of 0.010%), Immigrants from Japan (92.8%, a difference of 0.030%), Ukrainian (92.7%, a difference of 0.050%), and Zimbabwean (92.7%, a difference of 0.070%). Similarly, the demographic groups most similar to Cambodians are Immigrants from England (92.6%, a difference of 0.030%), French (92.6%, a difference of 0.040%), Burmese (92.6%, a difference of 0.050%), Immigrants from Moldova (92.6%, a difference of 0.050%), and Native Hawaiian (92.6%, a difference of 0.050%).
| Demographics | Rating | Rank | 12th Grade, No Diploma |
| Immigrants | Taiwan | 99.7 /100 | #58 | Exceptional 92.8% |
| Immigrants | North America | 99.7 /100 | #59 | Exceptional 92.8% |
| Slavs | 99.7 /100 | #60 | Exceptional 92.8% |
| Immigrants | Japan | 99.7 /100 | #61 | Exceptional 92.8% |
| Ukrainians | 99.6 /100 | #62 | Exceptional 92.7% |
| Zimbabweans | 99.6 /100 | #63 | Exceptional 92.7% |
| Immigrants | Netherlands | 99.6 /100 | #64 | Exceptional 92.7% |
| Austrians | 99.6 /100 | #65 | Exceptional 92.7% |
| Soviet Union | 99.6 /100 | #66 | Exceptional 92.7% |
| Immigrants | South Africa | 99.5 /100 | #67 | Exceptional 92.7% |
| Immigrants | Czechoslovakia | 99.5 /100 | #68 | Exceptional 92.7% |
| Immigrants | Iran | 99.5 /100 | #69 | Exceptional 92.7% |
| Czechoslovakians | 99.5 /100 | #70 | Exceptional 92.6% |
| Immigrants | Latvia | 99.5 /100 | #71 | Exceptional 92.6% |
| Immigrants | South Central Asia | 99.5 /100 | #72 | Exceptional 92.6% |
| Burmese | 99.4 /100 | #73 | Exceptional 92.6% |
| Immigrants | Moldova | 99.4 /100 | #74 | Exceptional 92.6% |
| Native Hawaiians | 99.4 /100 | #75 | Exceptional 92.6% |
| French | 99.4 /100 | #76 | Exceptional 92.6% |
| Immigrants | England | 99.4 /100 | #77 | Exceptional 92.6% |
| Cambodians | 99.3 /100 | #78 | Exceptional 92.6% |