Arab vs Indian (Asian) 12th Grade, No Diploma
COMPARE
Arab
Indian (Asian)
12th Grade, No Diploma
12th Grade, No Diploma Comparison
Arabs
Indians (Asian)
91.6%
12TH GRADE, NO DIPLOMA
84.1/ 100
METRIC RATING
138th/ 347
METRIC RANK
91.5%
12TH GRADE, NO DIPLOMA
79.4/ 100
METRIC RATING
148th/ 347
METRIC RANK
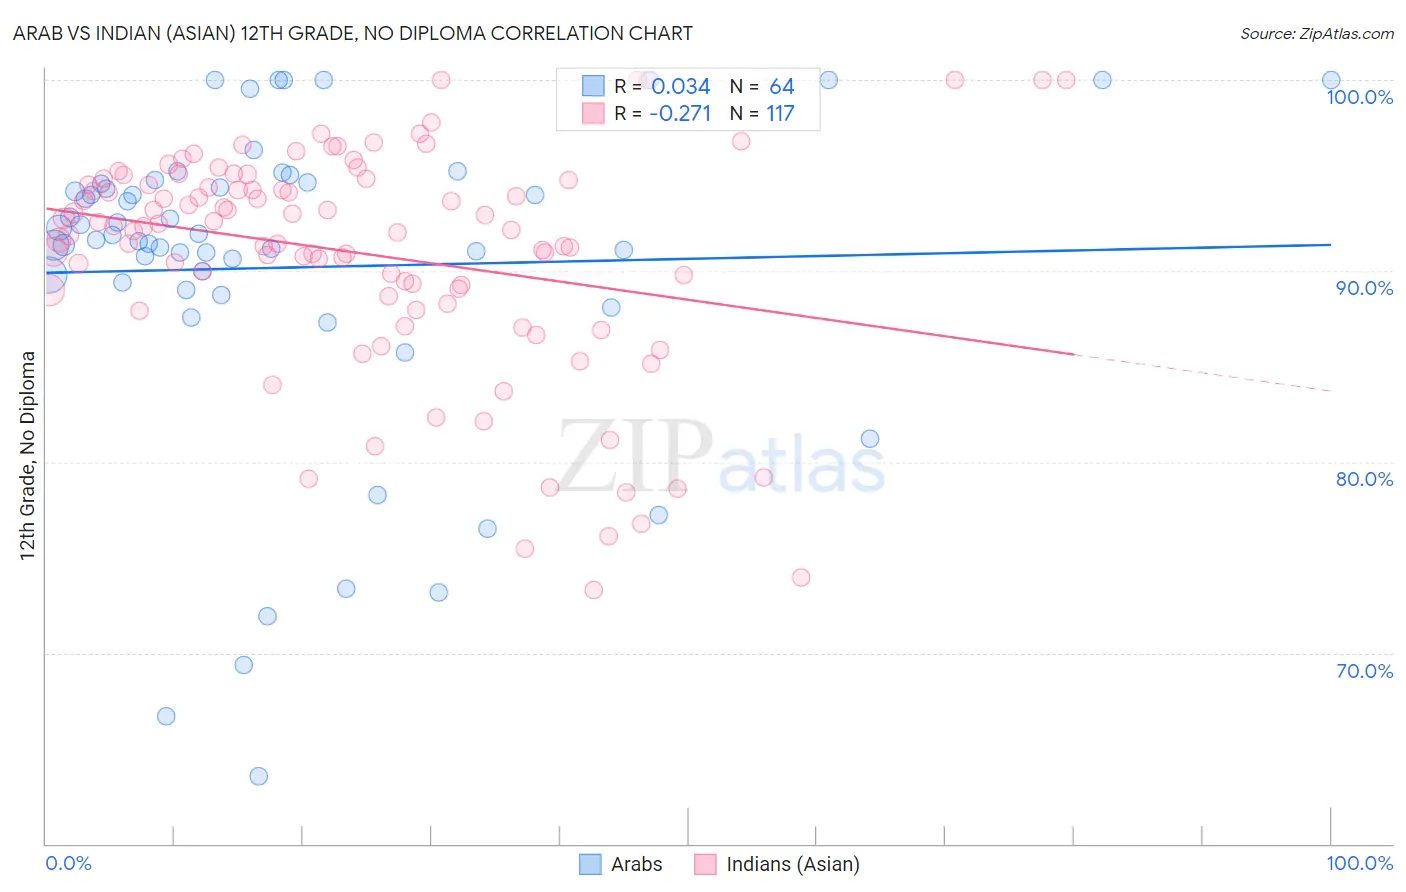
Arab vs Indian (Asian) 12th Grade, No Diploma Correlation Chart
The statistical analysis conducted on geographies consisting of 486,870,847 people shows no correlation between the proportion of Arabs and percentage of population with at least 12th grade (no diploma) education in the United States with a correlation coefficient (R) of 0.034 and weighted average of 91.6%. Similarly, the statistical analysis conducted on geographies consisting of 495,348,141 people shows a weak negative correlation between the proportion of Indians (Asian) and percentage of population with at least 12th grade (no diploma) education in the United States with a correlation coefficient (R) of -0.271 and weighted average of 91.5%, a difference of 0.10%.
12th Grade, No Diploma Correlation Summary
| Measurement | Arab | Indian (Asian) |
| Minimum | 63.5% | 73.3% |
| Maximum | 100.0% | 100.0% |
| Range | 36.5% | 26.7% |
| Mean | 90.2% | 90.9% |
| Median | 91.8% | 92.3% |
| Interquartile 25% (IQ1) | 89.2% | 88.8% |
| Interquartile 75% (IQ3) | 94.6% | 94.8% |
| Interquartile Range (IQR) | 5.4% | 5.9% |
| Standard Deviation (Sample) | 8.4% | 5.9% |
| Standard Deviation (Population) | 8.3% | 5.9% |
Demographics Similar to Arabs and Indians (Asian) by 12th Grade, No Diploma
In terms of 12th grade, no diploma, the demographic groups most similar to Arabs are Immigrants from Egypt (91.6%, a difference of 0.0%), Alaska Native (91.6%, a difference of 0.020%), Chilean (91.7%, a difference of 0.040%), Immigrants from Poland (91.6%, a difference of 0.040%), and Argentinean (91.6%, a difference of 0.050%). Similarly, the demographic groups most similar to Indians (Asian) are Pakistani (91.5%, a difference of 0.0%), Immigrants from Spain (91.6%, a difference of 0.010%), Immigrants from Lebanon (91.6%, a difference of 0.010%), Immigrants from Brazil (91.5%, a difference of 0.010%), and Ugandan (91.5%, a difference of 0.010%).
| Demographics | Rating | Rank | 12th Grade, No Diploma |
| Immigrants | Italy | 88.3 /100 | #133 | Excellent 91.7% |
| Venezuelans | 88.2 /100 | #134 | Excellent 91.7% |
| Immigrants | Bosnia and Herzegovina | 87.3 /100 | #135 | Excellent 91.7% |
| Chileans | 85.8 /100 | #136 | Excellent 91.7% |
| Alaska Natives | 84.9 /100 | #137 | Excellent 91.6% |
| Arabs | 84.1 /100 | #138 | Excellent 91.6% |
| Immigrants | Egypt | 83.9 /100 | #139 | Excellent 91.6% |
| Immigrants | Poland | 82.3 /100 | #140 | Excellent 91.6% |
| Argentineans | 82.0 /100 | #141 | Excellent 91.6% |
| Immigrants | Venezuela | 80.9 /100 | #142 | Excellent 91.6% |
| Immigrants | Argentina | 80.7 /100 | #143 | Excellent 91.6% |
| Immigrants | Spain | 80.1 /100 | #144 | Excellent 91.6% |
| Immigrants | Lebanon | 80.0 /100 | #145 | Excellent 91.6% |
| Immigrants | Brazil | 79.8 /100 | #146 | Good 91.5% |
| Pakistanis | 79.6 /100 | #147 | Good 91.5% |
| Indians (Asian) | 79.4 /100 | #148 | Good 91.5% |
| Ugandans | 79.0 /100 | #149 | Good 91.5% |
| Paraguayans | 78.9 /100 | #150 | Good 91.5% |
| Chippewa | 78.8 /100 | #151 | Good 91.5% |
| Kenyans | 77.4 /100 | #152 | Good 91.5% |
| Iraqis | 75.3 /100 | #153 | Good 91.5% |