Immigrants from Eritrea vs Indian (Asian) 12th Grade, No Diploma
COMPARE
Immigrants from Eritrea
Indian (Asian)
12th Grade, No Diploma
12th Grade, No Diploma Comparison
Immigrants from Eritrea
Indians (Asian)
89.9%
12TH GRADE, NO DIPLOMA
1.0/ 100
METRIC RATING
250th/ 347
METRIC RANK
91.5%
12TH GRADE, NO DIPLOMA
79.4/ 100
METRIC RATING
148th/ 347
METRIC RANK
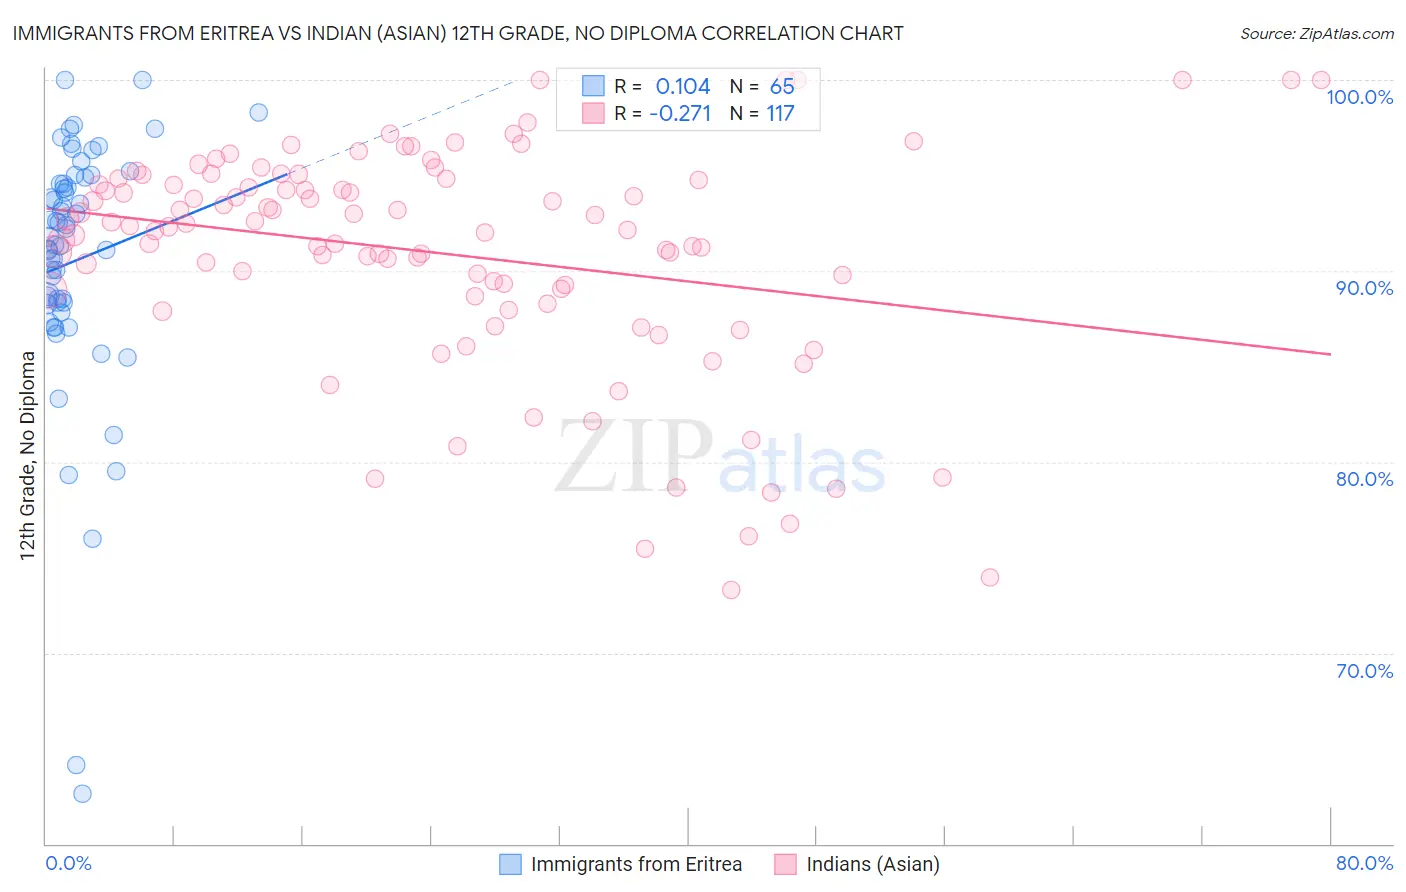
Immigrants from Eritrea vs Indian (Asian) 12th Grade, No Diploma Correlation Chart
The statistical analysis conducted on geographies consisting of 104,792,854 people shows a poor positive correlation between the proportion of Immigrants from Eritrea and percentage of population with at least 12th grade (no diploma) education in the United States with a correlation coefficient (R) of 0.104 and weighted average of 89.9%. Similarly, the statistical analysis conducted on geographies consisting of 495,348,141 people shows a weak negative correlation between the proportion of Indians (Asian) and percentage of population with at least 12th grade (no diploma) education in the United States with a correlation coefficient (R) of -0.271 and weighted average of 91.5%, a difference of 1.9%.
12th Grade, No Diploma Correlation Summary
| Measurement | Immigrants from Eritrea | Indian (Asian) |
| Minimum | 62.6% | 73.3% |
| Maximum | 100.0% | 100.0% |
| Range | 37.4% | 26.7% |
| Mean | 90.5% | 90.9% |
| Median | 91.8% | 92.3% |
| Interquartile 25% (IQ1) | 88.3% | 88.8% |
| Interquartile 75% (IQ3) | 94.7% | 94.8% |
| Interquartile Range (IQR) | 6.4% | 5.9% |
| Standard Deviation (Sample) | 6.9% | 5.9% |
| Standard Deviation (Population) | 6.8% | 5.9% |
Similar Demographics by 12th Grade, No Diploma
Demographics Similar to Immigrants from Eritrea by 12th Grade, No Diploma
In terms of 12th grade, no diploma, the demographic groups most similar to Immigrants from Eritrea are Spanish American (89.9%, a difference of 0.010%), Bahamian (89.9%, a difference of 0.010%), Comanche (89.9%, a difference of 0.030%), Senegalese (89.9%, a difference of 0.030%), and Immigrants from Nigeria (89.9%, a difference of 0.090%).
| Demographics | Rating | Rank | 12th Grade, No Diploma |
| Crow | 1.5 /100 | #243 | Tragic 90.0% |
| Taiwanese | 1.5 /100 | #244 | Tragic 90.0% |
| Immigrants | Uruguay | 1.4 /100 | #245 | Tragic 90.0% |
| Ghanaians | 1.3 /100 | #246 | Tragic 90.0% |
| Immigrants | Nigeria | 1.3 /100 | #247 | Tragic 89.9% |
| Comanche | 1.1 /100 | #248 | Tragic 89.9% |
| Senegalese | 1.1 /100 | #249 | Tragic 89.9% |
| Immigrants | Eritrea | 1.0 /100 | #250 | Tragic 89.9% |
| Spanish Americans | 0.9 /100 | #251 | Tragic 89.9% |
| Bahamians | 0.9 /100 | #252 | Tragic 89.9% |
| Choctaw | 0.7 /100 | #253 | Tragic 89.8% |
| Immigrants | Peru | 0.5 /100 | #254 | Tragic 89.7% |
| Immigrants | Senegal | 0.5 /100 | #255 | Tragic 89.7% |
| Immigrants | Ghana | 0.5 /100 | #256 | Tragic 89.7% |
| Jamaicans | 0.5 /100 | #257 | Tragic 89.7% |
Demographics Similar to Indians (Asian) by 12th Grade, No Diploma
In terms of 12th grade, no diploma, the demographic groups most similar to Indians (Asian) are Pakistani (91.5%, a difference of 0.0%), Immigrants from Spain (91.6%, a difference of 0.010%), Immigrants from Lebanon (91.6%, a difference of 0.010%), Immigrants from Brazil (91.5%, a difference of 0.010%), and Ugandan (91.5%, a difference of 0.010%).
| Demographics | Rating | Rank | 12th Grade, No Diploma |
| Argentineans | 82.0 /100 | #141 | Excellent 91.6% |
| Immigrants | Venezuela | 80.9 /100 | #142 | Excellent 91.6% |
| Immigrants | Argentina | 80.7 /100 | #143 | Excellent 91.6% |
| Immigrants | Spain | 80.1 /100 | #144 | Excellent 91.6% |
| Immigrants | Lebanon | 80.0 /100 | #145 | Excellent 91.6% |
| Immigrants | Brazil | 79.8 /100 | #146 | Good 91.5% |
| Pakistanis | 79.6 /100 | #147 | Good 91.5% |
| Indians (Asian) | 79.4 /100 | #148 | Good 91.5% |
| Ugandans | 79.0 /100 | #149 | Good 91.5% |
| Paraguayans | 78.9 /100 | #150 | Good 91.5% |
| Chippewa | 78.8 /100 | #151 | Good 91.5% |
| Kenyans | 77.4 /100 | #152 | Good 91.5% |
| Iraqis | 75.3 /100 | #153 | Good 91.5% |
| Immigrants | Kenya | 73.9 /100 | #154 | Good 91.5% |
| Immigrants | Iraq | 73.0 /100 | #155 | Good 91.4% |