Paraguayan vs Immigrants from Kenya Professional Degree
COMPARE
Paraguayan
Immigrants from Kenya
Professional Degree
Professional Degree Comparison
Paraguayans
Immigrants from Kenya
5.9%
PROFESSIONAL DEGREE
100.0/ 100
METRIC RATING
48th/ 347
METRIC RANK
4.4%
PROFESSIONAL DEGREE
45.9/ 100
METRIC RATING
179th/ 347
METRIC RANK
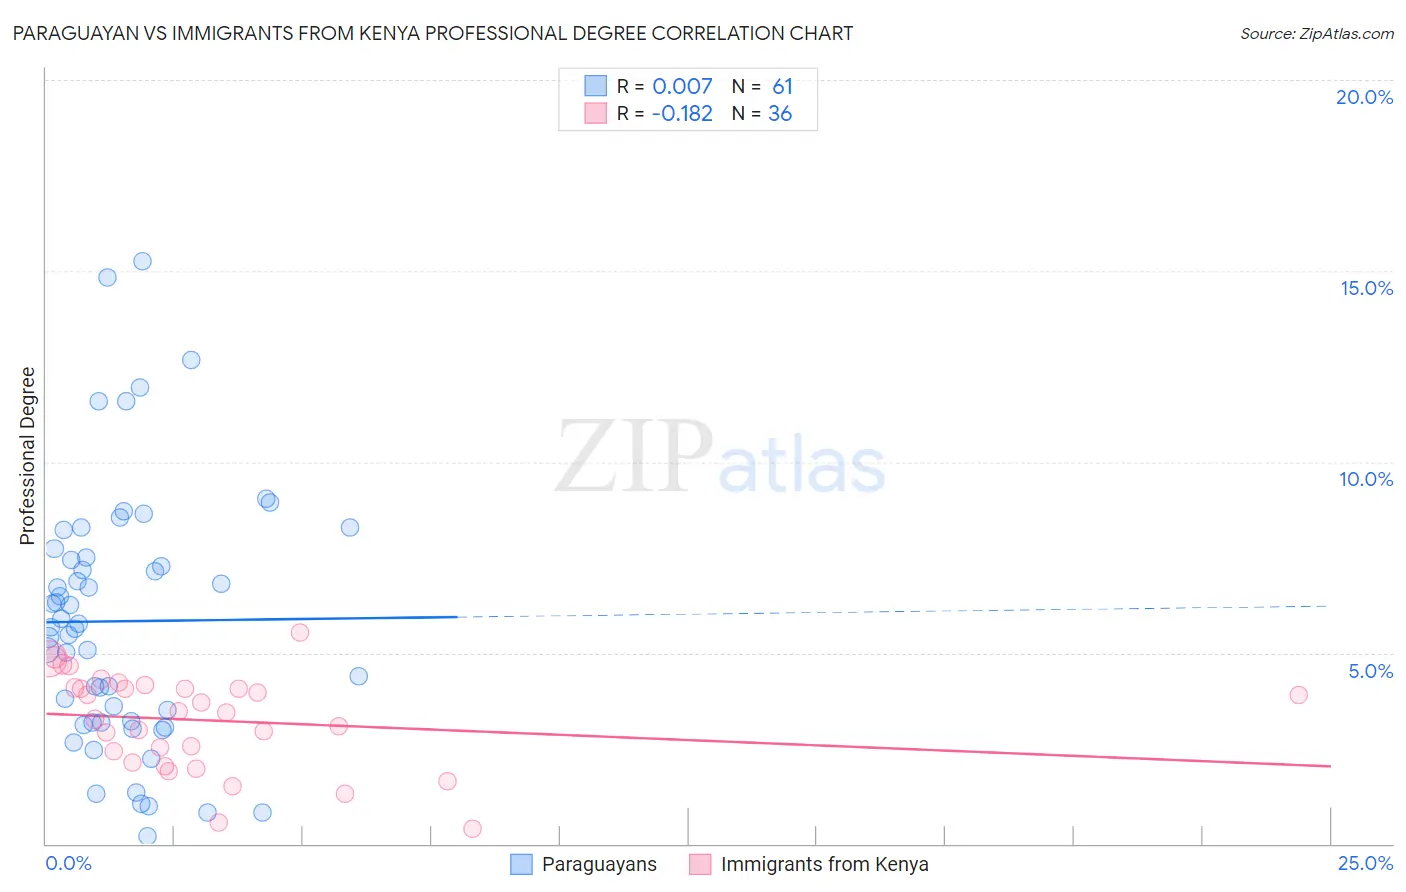
Paraguayan vs Immigrants from Kenya Professional Degree Correlation Chart
The statistical analysis conducted on geographies consisting of 95,046,034 people shows no correlation between the proportion of Paraguayans and percentage of population with at least professional degree education in the United States with a correlation coefficient (R) of 0.007 and weighted average of 5.9%. Similarly, the statistical analysis conducted on geographies consisting of 217,865,757 people shows a poor negative correlation between the proportion of Immigrants from Kenya and percentage of population with at least professional degree education in the United States with a correlation coefficient (R) of -0.182 and weighted average of 4.4%, a difference of 33.8%.
Professional Degree Correlation Summary
| Measurement | Paraguayan | Immigrants from Kenya |
| Minimum | 0.21% | 0.40% |
| Maximum | 15.3% | 5.5% |
| Range | 15.1% | 5.1% |
| Mean | 5.8% | 3.2% |
| Median | 5.7% | 3.5% |
| Interquartile 25% (IQ1) | 3.2% | 2.3% |
| Interquartile 75% (IQ3) | 7.6% | 4.1% |
| Interquartile Range (IQR) | 4.4% | 1.8% |
| Standard Deviation (Sample) | 3.4% | 1.3% |
| Standard Deviation (Population) | 3.3% | 1.2% |
Similar Demographics by Professional Degree
Demographics Similar to Paraguayans by Professional Degree
In terms of professional degree, the demographic groups most similar to Paraguayans are Immigrants from Latvia (5.8%, a difference of 0.40%), Australian (5.9%, a difference of 0.42%), Immigrants from Argentina (5.9%, a difference of 0.43%), Immigrants from South Central Asia (5.9%, a difference of 0.63%), and Immigrants from Czechoslovakia (5.8%, a difference of 0.72%).
| Demographics | Rating | Rank | Professional Degree |
| New Zealanders | 100.0 /100 | #41 | Exceptional 6.0% |
| Estonians | 100.0 /100 | #42 | Exceptional 6.0% |
| Immigrants | Saudi Arabia | 100.0 /100 | #43 | Exceptional 5.9% |
| Argentineans | 100.0 /100 | #44 | Exceptional 5.9% |
| Immigrants | South Central Asia | 100.0 /100 | #45 | Exceptional 5.9% |
| Immigrants | Argentina | 100.0 /100 | #46 | Exceptional 5.9% |
| Australians | 100.0 /100 | #47 | Exceptional 5.9% |
| Paraguayans | 100.0 /100 | #48 | Exceptional 5.9% |
| Immigrants | Latvia | 100.0 /100 | #49 | Exceptional 5.8% |
| Immigrants | Czechoslovakia | 100.0 /100 | #50 | Exceptional 5.8% |
| Immigrants | Greece | 100.0 /100 | #51 | Exceptional 5.8% |
| Immigrants | Serbia | 100.0 /100 | #52 | Exceptional 5.8% |
| Immigrants | Netherlands | 100.0 /100 | #53 | Exceptional 5.8% |
| Immigrants | Kuwait | 100.0 /100 | #54 | Exceptional 5.7% |
| Immigrants | Western Europe | 100.0 /100 | #55 | Exceptional 5.7% |
Demographics Similar to Immigrants from Kenya by Professional Degree
In terms of professional degree, the demographic groups most similar to Immigrants from Kenya are Immigrants from Costa Rica (4.4%, a difference of 0.11%), Czech (4.4%, a difference of 0.15%), Celtic (4.4%, a difference of 0.24%), Danish (4.4%, a difference of 0.36%), and Immigrants (4.4%, a difference of 0.41%).
| Demographics | Rating | Rank | Professional Degree |
| Spaniards | 52.0 /100 | #172 | Average 4.4% |
| English | 50.1 /100 | #173 | Average 4.4% |
| Kenyans | 50.0 /100 | #174 | Average 4.4% |
| Irish | 50.0 /100 | #175 | Average 4.4% |
| Immigrants | Peru | 49.3 /100 | #176 | Average 4.4% |
| Celtics | 47.6 /100 | #177 | Average 4.4% |
| Immigrants | Costa Rica | 46.7 /100 | #178 | Average 4.4% |
| Immigrants | Kenya | 45.9 /100 | #179 | Average 4.4% |
| Czechs | 44.9 /100 | #180 | Average 4.4% |
| Danes | 43.5 /100 | #181 | Average 4.4% |
| Immigrants | Immigrants | 43.2 /100 | #182 | Average 4.4% |
| Bermudans | 43.1 /100 | #183 | Average 4.4% |
| Belgians | 36.2 /100 | #184 | Fair 4.3% |
| Welsh | 35.8 /100 | #185 | Fair 4.3% |
| Scotch-Irish | 34.2 /100 | #186 | Fair 4.3% |