Native Hawaiian vs English College, 1 year or more
COMPARE
Native Hawaiian
English
College, 1 year or more
College, 1 year or more Comparison
Native Hawaiians
English
57.6%
COLLEGE, 1 YEAR OR MORE
9.0/ 100
METRIC RATING
218th/ 347
METRIC RANK
60.0%
COLLEGE, 1 YEAR OR MORE
67.2/ 100
METRIC RATING
158th/ 347
METRIC RANK
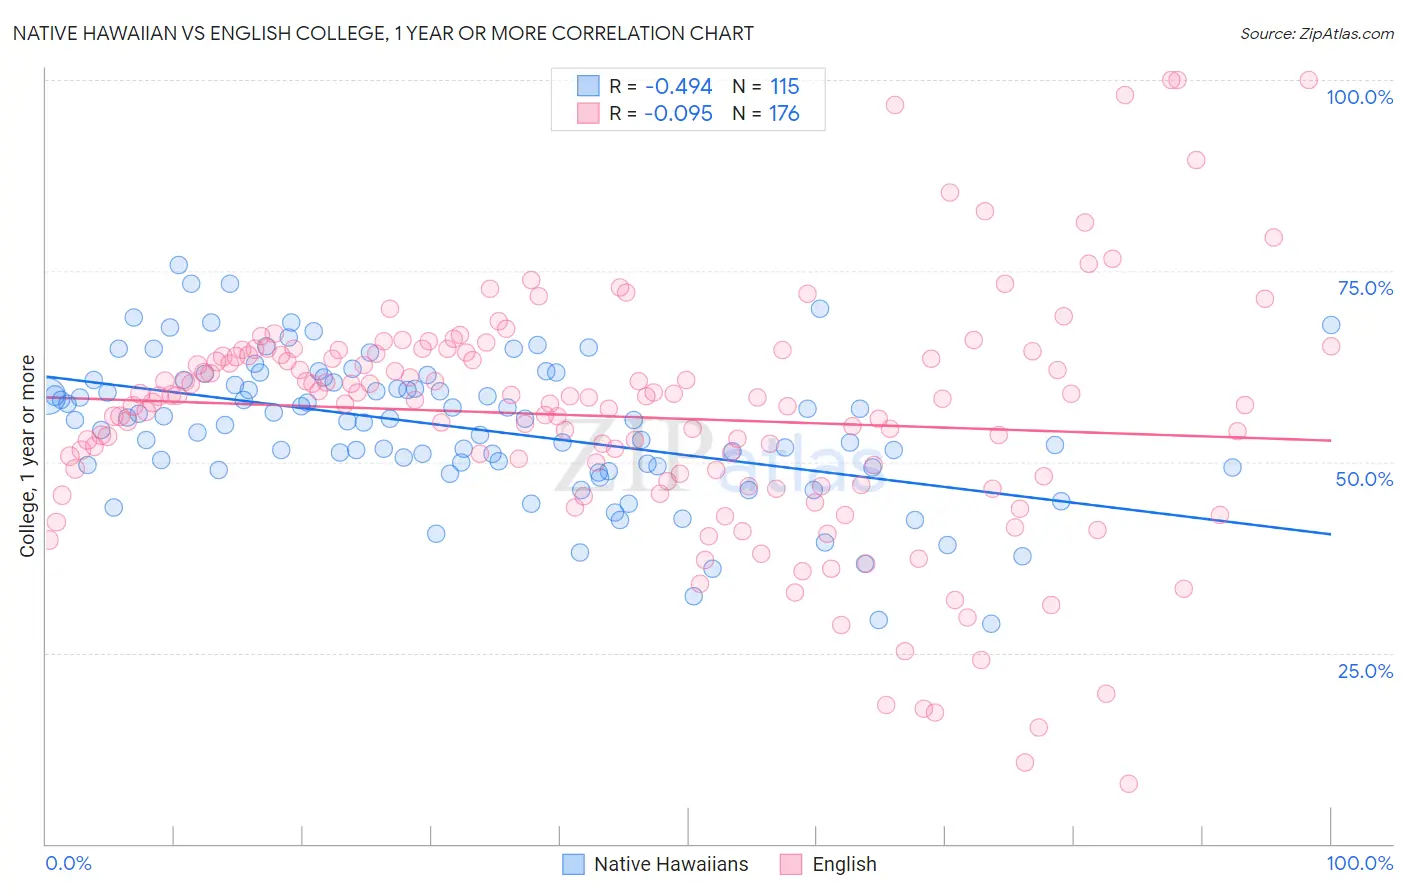
Native Hawaiian vs English College, 1 year or more Correlation Chart
The statistical analysis conducted on geographies consisting of 332,118,930 people shows a moderate negative correlation between the proportion of Native Hawaiians and percentage of population with at least college, 1 year or more education in the United States with a correlation coefficient (R) of -0.494 and weighted average of 57.6%. Similarly, the statistical analysis conducted on geographies consisting of 579,957,546 people shows a slight negative correlation between the proportion of English and percentage of population with at least college, 1 year or more education in the United States with a correlation coefficient (R) of -0.095 and weighted average of 60.0%, a difference of 4.1%.
College, 1 year or more Correlation Summary
| Measurement | Native Hawaiian | English |
| Minimum | 28.7% | 7.9% |
| Maximum | 75.7% | 100.0% |
| Range | 47.0% | 92.1% |
| Mean | 54.6% | 55.9% |
| Median | 55.5% | 58.3% |
| Interquartile 25% (IQ1) | 49.5% | 47.8% |
| Interquartile 75% (IQ3) | 60.7% | 64.2% |
| Interquartile Range (IQR) | 11.2% | 16.4% |
| Standard Deviation (Sample) | 9.2% | 15.8% |
| Standard Deviation (Population) | 9.2% | 15.8% |
Similar Demographics by College, 1 year or more
Demographics Similar to Native Hawaiians by College, 1 year or more
In terms of college, 1 year or more, the demographic groups most similar to Native Hawaiians are Immigrants from Panama (57.6%, a difference of 0.0%), White/Caucasian (57.6%, a difference of 0.060%), Immigrants from Costa Rica (57.5%, a difference of 0.18%), Immigrants from Peru (57.7%, a difference of 0.24%), and Immigrants from Ghana (57.4%, a difference of 0.25%).
| Demographics | Rating | Rank | College, 1 year or more |
| Immigrants | Nigeria | 13.3 /100 | #211 | Poor 57.9% |
| Immigrants | Senegal | 11.8 /100 | #212 | Poor 57.8% |
| French Canadians | 11.8 /100 | #213 | Poor 57.8% |
| Immigrants | Colombia | 11.6 /100 | #214 | Poor 57.8% |
| Tongans | 11.6 /100 | #215 | Poor 57.8% |
| Immigrants | Peru | 10.6 /100 | #216 | Poor 57.7% |
| Immigrants | Panama | 9.1 /100 | #217 | Tragic 57.6% |
| Native Hawaiians | 9.0 /100 | #218 | Tragic 57.6% |
| Whites/Caucasians | 8.7 /100 | #219 | Tragic 57.6% |
| Immigrants | Costa Rica | 8.0 /100 | #220 | Tragic 57.5% |
| Immigrants | Ghana | 7.7 /100 | #221 | Tragic 57.4% |
| Sub-Saharan Africans | 6.1 /100 | #222 | Tragic 57.3% |
| Portuguese | 5.4 /100 | #223 | Tragic 57.2% |
| Hmong | 5.4 /100 | #224 | Tragic 57.2% |
| Vietnamese | 4.7 /100 | #225 | Tragic 57.0% |
Demographics Similar to English by College, 1 year or more
In terms of college, 1 year or more, the demographic groups most similar to English are Immigrants from Iraq (60.0%, a difference of 0.010%), South American Indian (60.0%, a difference of 0.020%), Immigrants from Armenia (60.0%, a difference of 0.10%), Somali (59.9%, a difference of 0.15%), and Sudanese (60.2%, a difference of 0.36%).
| Demographics | Rating | Rank | College, 1 year or more |
| Albanians | 77.8 /100 | #151 | Good 60.4% |
| Immigrants | Germany | 76.1 /100 | #152 | Good 60.3% |
| Sierra Leoneans | 74.1 /100 | #153 | Good 60.2% |
| Sudanese | 73.0 /100 | #154 | Good 60.2% |
| Moroccans | 72.9 /100 | #155 | Good 60.2% |
| Finns | 72.9 /100 | #156 | Good 60.2% |
| Immigrants | Armenia | 68.8 /100 | #157 | Good 60.0% |
| English | 67.2 /100 | #158 | Good 60.0% |
| Immigrants | Iraq | 67.0 /100 | #159 | Good 60.0% |
| South American Indians | 66.9 /100 | #160 | Good 60.0% |
| Somalis | 64.5 /100 | #161 | Good 59.9% |
| Koreans | 58.5 /100 | #162 | Average 59.7% |
| Immigrants | Somalia | 58.3 /100 | #163 | Average 59.7% |
| Belgians | 58.1 /100 | #164 | Average 59.7% |
| Irish | 56.1 /100 | #165 | Average 59.6% |