Moroccan vs Jordanian In Labor Force | Age 25-29
COMPARE
Moroccan
Jordanian
In Labor Force | Age 25-29
In Labor Force | Age 25-29 Comparison
Moroccans
Jordanians
84.5%
IN LABOR FORCE | AGE 25-29
32.6/ 100
METRIC RATING
189th/ 347
METRIC RANK
84.2%
IN LABOR FORCE | AGE 25-29
6.7/ 100
METRIC RATING
222nd/ 347
METRIC RANK
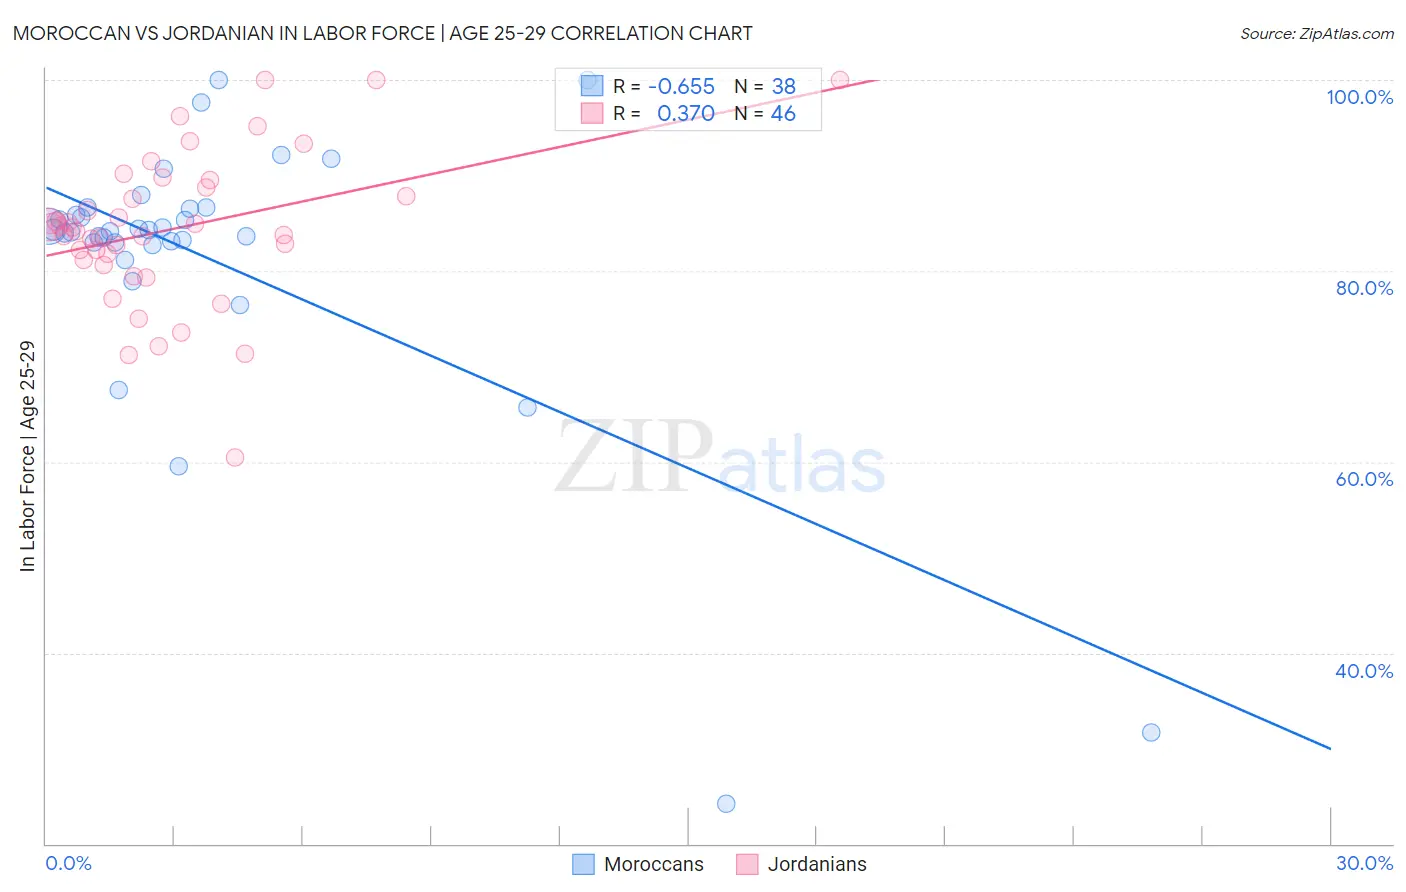
Moroccan vs Jordanian In Labor Force | Age 25-29 Correlation Chart
The statistical analysis conducted on geographies consisting of 201,777,883 people shows a significant negative correlation between the proportion of Moroccans and labor force participation rate among population between the ages 25 and 29 in the United States with a correlation coefficient (R) of -0.655 and weighted average of 84.5%. Similarly, the statistical analysis conducted on geographies consisting of 166,391,810 people shows a mild positive correlation between the proportion of Jordanians and labor force participation rate among population between the ages 25 and 29 in the United States with a correlation coefficient (R) of 0.370 and weighted average of 84.2%, a difference of 0.35%.
In Labor Force | Age 25-29 Correlation Summary
| Measurement | Moroccan | Jordanian |
| Minimum | 24.2% | 60.5% |
| Maximum | 100.0% | 100.0% |
| Range | 75.8% | 39.5% |
| Mean | 81.2% | 84.4% |
| Median | 84.2% | 84.3% |
| Interquartile 25% (IQ1) | 83.0% | 81.2% |
| Interquartile 75% (IQ3) | 86.5% | 88.8% |
| Interquartile Range (IQR) | 3.5% | 7.6% |
| Standard Deviation (Sample) | 14.9% | 7.9% |
| Standard Deviation (Population) | 14.7% | 7.8% |
Similar Demographics by In Labor Force | Age 25-29
Demographics Similar to Moroccans by In Labor Force | Age 25-29
In terms of in labor force | age 25-29, the demographic groups most similar to Moroccans are Immigrants from Ukraine (84.5%, a difference of 0.010%), Welsh (84.5%, a difference of 0.010%), Immigrants from Belgium (84.6%, a difference of 0.020%), Immigrants from Portugal (84.6%, a difference of 0.020%), and Zimbabwean (84.5%, a difference of 0.030%).
| Demographics | Rating | Rank | In Labor Force | Age 25-29 |
| Europeans | 40.3 /100 | #182 | Average 84.6% |
| Scottish | 40.1 /100 | #183 | Average 84.6% |
| Immigrants | Kuwait | 38.2 /100 | #184 | Fair 84.6% |
| Immigrants | Denmark | 37.0 /100 | #185 | Fair 84.6% |
| Immigrants | Belgium | 35.0 /100 | #186 | Fair 84.6% |
| Immigrants | Portugal | 34.7 /100 | #187 | Fair 84.6% |
| Immigrants | Ukraine | 33.7 /100 | #188 | Fair 84.5% |
| Moroccans | 32.6 /100 | #189 | Fair 84.5% |
| Welsh | 31.1 /100 | #190 | Fair 84.5% |
| Zimbabweans | 28.7 /100 | #191 | Fair 84.5% |
| English | 25.8 /100 | #192 | Fair 84.5% |
| South American Indians | 25.0 /100 | #193 | Fair 84.5% |
| Portuguese | 21.2 /100 | #194 | Fair 84.4% |
| Immigrants | Israel | 20.8 /100 | #195 | Fair 84.4% |
| Immigrants | South Eastern Asia | 19.5 /100 | #196 | Poor 84.4% |
Demographics Similar to Jordanians by In Labor Force | Age 25-29
In terms of in labor force | age 25-29, the demographic groups most similar to Jordanians are Arab (84.2%, a difference of 0.0%), Nigerian (84.3%, a difference of 0.010%), Scotch-Irish (84.2%, a difference of 0.010%), Immigrants from West Indies (84.2%, a difference of 0.020%), and Korean (84.2%, a difference of 0.030%).
| Demographics | Rating | Rank | In Labor Force | Age 25-29 |
| Immigrants | Syria | 10.7 /100 | #215 | Poor 84.3% |
| Israelis | 9.3 /100 | #216 | Tragic 84.3% |
| Immigrants | Ecuador | 9.3 /100 | #217 | Tragic 84.3% |
| Immigrants | Nigeria | 9.0 /100 | #218 | Tragic 84.3% |
| Immigrants | Saudi Arabia | 8.8 /100 | #219 | Tragic 84.3% |
| Nigerians | 7.2 /100 | #220 | Tragic 84.3% |
| Arabs | 6.8 /100 | #221 | Tragic 84.2% |
| Jordanians | 6.7 /100 | #222 | Tragic 84.2% |
| Scotch-Irish | 6.5 /100 | #223 | Tragic 84.2% |
| Immigrants | West Indies | 6.0 /100 | #224 | Tragic 84.2% |
| Koreans | 5.9 /100 | #225 | Tragic 84.2% |
| Immigrants | Congo | 5.8 /100 | #226 | Tragic 84.2% |
| French American Indians | 5.5 /100 | #227 | Tragic 84.2% |
| Immigrants | Panama | 5.5 /100 | #228 | Tragic 84.2% |
| Immigrants | Oceania | 5.0 /100 | #229 | Tragic 84.2% |