Cape Verdean vs Immigrants from Poland 3rd Grade
COMPARE
Cape Verdean
Immigrants from Poland
3rd Grade
3rd Grade Comparison
Cape Verdeans
Immigrants from Poland
96.6%
3RD GRADE
0.0/ 100
METRIC RATING
310th/ 347
METRIC RANK
97.8%
3RD GRADE
47.1/ 100
METRIC RATING
176th/ 347
METRIC RANK
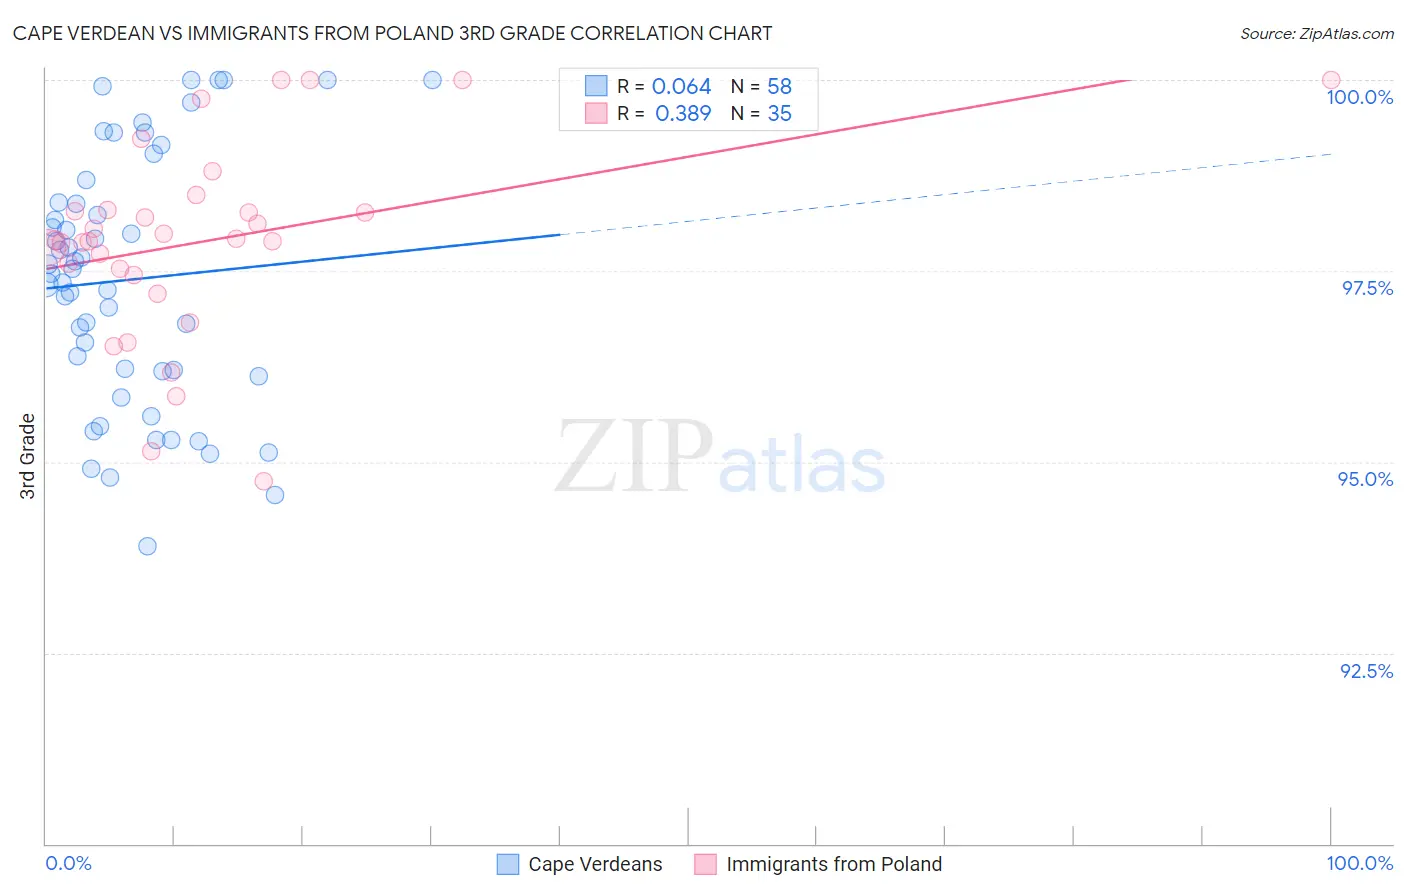
Cape Verdean vs Immigrants from Poland 3rd Grade Correlation Chart
The statistical analysis conducted on geographies consisting of 107,537,955 people shows a slight positive correlation between the proportion of Cape Verdeans and percentage of population with at least 3rd grade education in the United States with a correlation coefficient (R) of 0.064 and weighted average of 96.6%. Similarly, the statistical analysis conducted on geographies consisting of 304,861,559 people shows a mild positive correlation between the proportion of Immigrants from Poland and percentage of population with at least 3rd grade education in the United States with a correlation coefficient (R) of 0.389 and weighted average of 97.8%, a difference of 1.1%.
3rd Grade Correlation Summary
| Measurement | Cape Verdean | Immigrants from Poland |
| Minimum | 93.9% | 94.8% |
| Maximum | 100.0% | 100.0% |
| Range | 6.1% | 5.2% |
| Mean | 97.4% | 97.9% |
| Median | 97.5% | 97.9% |
| Interquartile 25% (IQ1) | 96.2% | 97.4% |
| Interquartile 75% (IQ3) | 98.4% | 98.3% |
| Interquartile Range (IQR) | 2.2% | 0.86% |
| Standard Deviation (Sample) | 1.6% | 1.3% |
| Standard Deviation (Population) | 1.6% | 1.3% |
Similar Demographics by 3rd Grade
Demographics Similar to Cape Verdeans by 3rd Grade
In terms of 3rd grade, the demographic groups most similar to Cape Verdeans are Nicaraguan (96.7%, a difference of 0.030%), Immigrants from Haiti (96.7%, a difference of 0.030%), Sri Lankan (96.7%, a difference of 0.030%), Immigrants from Guyana (96.6%, a difference of 0.030%), and Immigrants from Laos (96.6%, a difference of 0.040%).
| Demographics | Rating | Rank | 3rd Grade |
| Ecuadorians | 0.0 /100 | #303 | Tragic 96.7% |
| Immigrants | Caribbean | 0.0 /100 | #304 | Tragic 96.7% |
| Central American Indians | 0.0 /100 | #305 | Tragic 96.7% |
| Guyanese | 0.0 /100 | #306 | Tragic 96.7% |
| Nicaraguans | 0.0 /100 | #307 | Tragic 96.7% |
| Immigrants | Haiti | 0.0 /100 | #308 | Tragic 96.7% |
| Sri Lankans | 0.0 /100 | #309 | Tragic 96.7% |
| Cape Verdeans | 0.0 /100 | #310 | Tragic 96.6% |
| Immigrants | Guyana | 0.0 /100 | #311 | Tragic 96.6% |
| Immigrants | Laos | 0.0 /100 | #312 | Tragic 96.6% |
| Immigrants | Ecuador | 0.0 /100 | #313 | Tragic 96.6% |
| Belizeans | 0.0 /100 | #314 | Tragic 96.6% |
| Immigrants | Azores | 0.0 /100 | #315 | Tragic 96.6% |
| Immigrants | Burma/Myanmar | 0.0 /100 | #316 | Tragic 96.6% |
| Immigrants | Bangladesh | 0.0 /100 | #317 | Tragic 96.6% |
Demographics Similar to Immigrants from Poland by 3rd Grade
In terms of 3rd grade, the demographic groups most similar to Immigrants from Poland are Immigrants from Micronesia (97.8%, a difference of 0.0%), Egyptian (97.7%, a difference of 0.0%), Immigrants from Brazil (97.7%, a difference of 0.0%), Immigrants from Belarus (97.7%, a difference of 0.0%), and Immigrants from Korea (97.8%, a difference of 0.010%).
| Demographics | Rating | Rank | 3rd Grade |
| Comanche | 53.8 /100 | #169 | Average 97.8% |
| Brazilians | 53.7 /100 | #170 | Average 97.8% |
| Kenyans | 51.8 /100 | #171 | Average 97.8% |
| Spanish Americans | 51.8 /100 | #172 | Average 97.8% |
| Immigrants | Korea | 50.9 /100 | #173 | Average 97.8% |
| Navajo | 50.0 /100 | #174 | Average 97.8% |
| Immigrants | Micronesia | 47.6 /100 | #175 | Average 97.8% |
| Immigrants | Poland | 47.1 /100 | #176 | Average 97.8% |
| Egyptians | 46.6 /100 | #177 | Average 97.7% |
| Immigrants | Brazil | 46.4 /100 | #178 | Average 97.7% |
| Immigrants | Belarus | 45.9 /100 | #179 | Average 97.7% |
| Immigrants | Sri Lanka | 45.1 /100 | #180 | Average 97.7% |
| Immigrants | Venezuela | 44.4 /100 | #181 | Average 97.7% |
| Argentineans | 42.9 /100 | #182 | Average 97.7% |
| Arabs | 40.0 /100 | #183 | Fair 97.7% |