Moroccan vs Immigrants from Cuba 3rd Grade
COMPARE
Moroccan
Immigrants from Cuba
3rd Grade
3rd Grade Comparison
Moroccans
Immigrants from Cuba
97.6%
3RD GRADE
8.5/ 100
METRIC RATING
213th/ 347
METRIC RANK
96.8%
3RD GRADE
0.0/ 100
METRIC RATING
301st/ 347
METRIC RANK
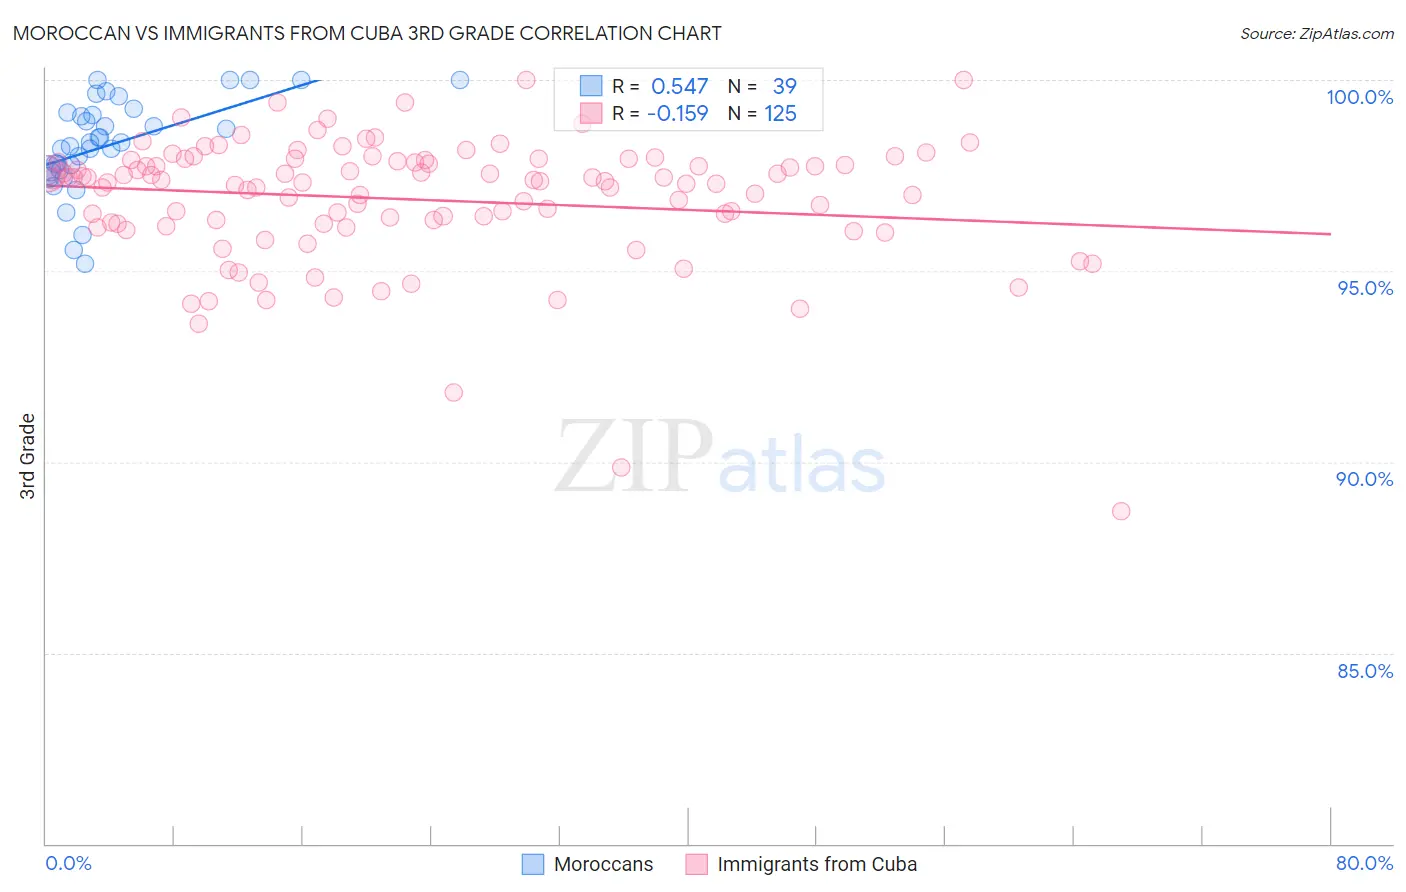
Moroccan vs Immigrants from Cuba 3rd Grade Correlation Chart
The statistical analysis conducted on geographies consisting of 201,817,667 people shows a substantial positive correlation between the proportion of Moroccans and percentage of population with at least 3rd grade education in the United States with a correlation coefficient (R) of 0.547 and weighted average of 97.6%. Similarly, the statistical analysis conducted on geographies consisting of 326,028,159 people shows a poor negative correlation between the proportion of Immigrants from Cuba and percentage of population with at least 3rd grade education in the United States with a correlation coefficient (R) of -0.159 and weighted average of 96.8%, a difference of 0.76%.
3rd Grade Correlation Summary
| Measurement | Moroccan | Immigrants from Cuba |
| Minimum | 95.2% | 88.7% |
| Maximum | 100.0% | 100.0% |
| Range | 4.8% | 11.3% |
| Mean | 98.3% | 96.9% |
| Median | 98.3% | 97.3% |
| Interquartile 25% (IQ1) | 97.6% | 96.2% |
| Interquartile 75% (IQ3) | 99.1% | 97.9% |
| Interquartile Range (IQR) | 1.5% | 1.6% |
| Standard Deviation (Sample) | 1.2% | 1.7% |
| Standard Deviation (Population) | 1.2% | 1.7% |
Similar Demographics by 3rd Grade
Demographics Similar to Moroccans by 3rd Grade
In terms of 3rd grade, the demographic groups most similar to Moroccans are Immigrants from Bahamas (97.6%, a difference of 0.0%), Yuman (97.6%, a difference of 0.0%), Costa Rican (97.6%, a difference of 0.010%), Immigrants from Oceania (97.6%, a difference of 0.010%), and Laotian (97.6%, a difference of 0.010%).
| Demographics | Rating | Rank | 3rd Grade |
| Immigrants | Northern Africa | 13.0 /100 | #206 | Poor 97.6% |
| Tohono O'odham | 12.5 /100 | #207 | Poor 97.6% |
| Immigrants | Zaire | 11.9 /100 | #208 | Poor 97.6% |
| Costa Ricans | 9.6 /100 | #209 | Tragic 97.6% |
| Immigrants | Oceania | 9.5 /100 | #210 | Tragic 97.6% |
| Laotians | 9.4 /100 | #211 | Tragic 97.6% |
| Immigrants | Bahamas | 8.5 /100 | #212 | Tragic 97.6% |
| Moroccans | 8.5 /100 | #213 | Tragic 97.6% |
| Yuman | 8.4 /100 | #214 | Tragic 97.6% |
| Iraqis | 6.9 /100 | #215 | Tragic 97.5% |
| Samoans | 6.9 /100 | #216 | Tragic 97.5% |
| South American Indians | 5.7 /100 | #217 | Tragic 97.5% |
| Immigrants | Nepal | 5.3 /100 | #218 | Tragic 97.5% |
| Immigrants | Panama | 5.2 /100 | #219 | Tragic 97.5% |
| Immigrants | Morocco | 5.0 /100 | #220 | Tragic 97.5% |
Demographics Similar to Immigrants from Cuba by 3rd Grade
In terms of 3rd grade, the demographic groups most similar to Immigrants from Cuba are Immigrants from South Eastern Asia (96.8%, a difference of 0.010%), Somali (96.8%, a difference of 0.020%), Haitian (96.9%, a difference of 0.030%), Immigrants from Dominica (96.9%, a difference of 0.030%), and Immigrants (96.9%, a difference of 0.050%).
| Demographics | Rating | Rank | 3rd Grade |
| Malaysians | 0.0 /100 | #294 | Tragic 97.0% |
| Immigrants | Eritrea | 0.0 /100 | #295 | Tragic 97.0% |
| Immigrants | Immigrants | 0.0 /100 | #296 | Tragic 96.9% |
| Haitians | 0.0 /100 | #297 | Tragic 96.9% |
| Immigrants | Dominica | 0.0 /100 | #298 | Tragic 96.9% |
| Somalis | 0.0 /100 | #299 | Tragic 96.8% |
| Immigrants | South Eastern Asia | 0.0 /100 | #300 | Tragic 96.8% |
| Immigrants | Cuba | 0.0 /100 | #301 | Tragic 96.8% |
| Immigrants | Somalia | 0.0 /100 | #302 | Tragic 96.8% |
| Ecuadorians | 0.0 /100 | #303 | Tragic 96.7% |
| Immigrants | Caribbean | 0.0 /100 | #304 | Tragic 96.7% |
| Central American Indians | 0.0 /100 | #305 | Tragic 96.7% |
| Guyanese | 0.0 /100 | #306 | Tragic 96.7% |
| Nicaraguans | 0.0 /100 | #307 | Tragic 96.7% |
| Immigrants | Haiti | 0.0 /100 | #308 | Tragic 96.7% |