Moroccan vs Japanese 3rd Grade
COMPARE
Moroccan
Japanese
3rd Grade
3rd Grade Comparison
Moroccans
Japanese
97.6%
3RD GRADE
8.5/ 100
METRIC RATING
213th/ 347
METRIC RANK
96.4%
3RD GRADE
0.0/ 100
METRIC RATING
327th/ 347
METRIC RANK
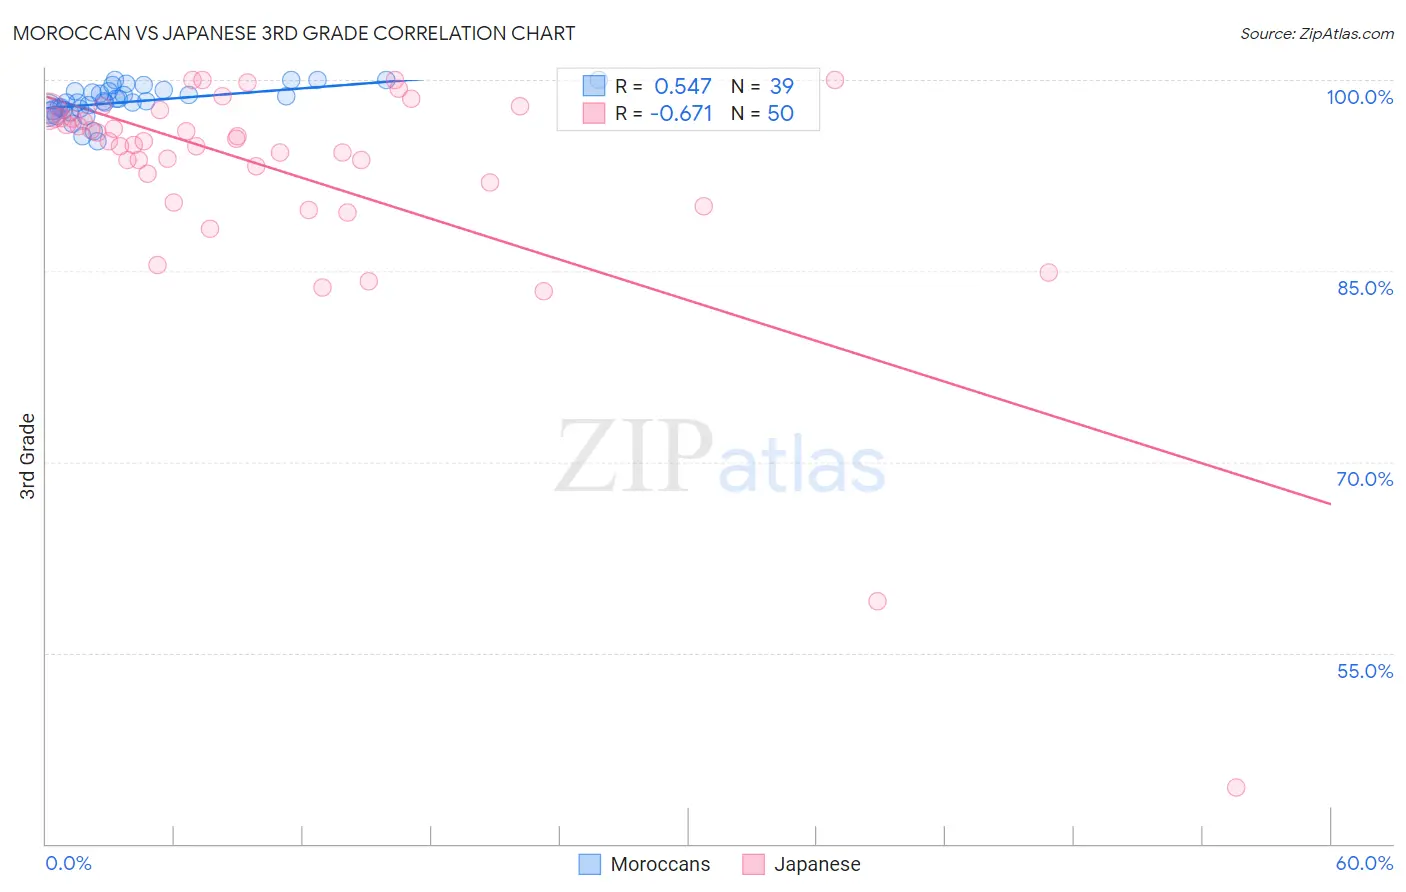
Moroccan vs Japanese 3rd Grade Correlation Chart
The statistical analysis conducted on geographies consisting of 201,817,667 people shows a substantial positive correlation between the proportion of Moroccans and percentage of population with at least 3rd grade education in the United States with a correlation coefficient (R) of 0.547 and weighted average of 97.6%. Similarly, the statistical analysis conducted on geographies consisting of 249,183,224 people shows a significant negative correlation between the proportion of Japanese and percentage of population with at least 3rd grade education in the United States with a correlation coefficient (R) of -0.671 and weighted average of 96.4%, a difference of 1.3%.
3rd Grade Correlation Summary
| Measurement | Moroccan | Japanese |
| Minimum | 95.2% | 44.4% |
| Maximum | 100.0% | 100.0% |
| Range | 4.8% | 55.6% |
| Mean | 98.3% | 92.7% |
| Median | 98.3% | 95.2% |
| Interquartile 25% (IQ1) | 97.6% | 92.0% |
| Interquartile 75% (IQ3) | 99.1% | 97.1% |
| Interquartile Range (IQR) | 1.5% | 5.1% |
| Standard Deviation (Sample) | 1.2% | 9.6% |
| Standard Deviation (Population) | 1.2% | 9.5% |
Similar Demographics by 3rd Grade
Demographics Similar to Moroccans by 3rd Grade
In terms of 3rd grade, the demographic groups most similar to Moroccans are Immigrants from Bahamas (97.6%, a difference of 0.0%), Yuman (97.6%, a difference of 0.0%), Costa Rican (97.6%, a difference of 0.010%), Immigrants from Oceania (97.6%, a difference of 0.010%), and Laotian (97.6%, a difference of 0.010%).
| Demographics | Rating | Rank | 3rd Grade |
| Immigrants | Northern Africa | 13.0 /100 | #206 | Poor 97.6% |
| Tohono O'odham | 12.5 /100 | #207 | Poor 97.6% |
| Immigrants | Zaire | 11.9 /100 | #208 | Poor 97.6% |
| Costa Ricans | 9.6 /100 | #209 | Tragic 97.6% |
| Immigrants | Oceania | 9.5 /100 | #210 | Tragic 97.6% |
| Laotians | 9.4 /100 | #211 | Tragic 97.6% |
| Immigrants | Bahamas | 8.5 /100 | #212 | Tragic 97.6% |
| Moroccans | 8.5 /100 | #213 | Tragic 97.6% |
| Yuman | 8.4 /100 | #214 | Tragic 97.6% |
| Iraqis | 6.9 /100 | #215 | Tragic 97.5% |
| Samoans | 6.9 /100 | #216 | Tragic 97.5% |
| South American Indians | 5.7 /100 | #217 | Tragic 97.5% |
| Immigrants | Nepal | 5.3 /100 | #218 | Tragic 97.5% |
| Immigrants | Panama | 5.2 /100 | #219 | Tragic 97.5% |
| Immigrants | Morocco | 5.0 /100 | #220 | Tragic 97.5% |
Demographics Similar to Japanese by 3rd Grade
In terms of 3rd grade, the demographic groups most similar to Japanese are Immigrants from Vietnam (96.4%, a difference of 0.010%), Bangladeshi (96.3%, a difference of 0.010%), Immigrants from Honduras (96.3%, a difference of 0.020%), Mexican American Indian (96.4%, a difference of 0.040%), and Dominican (96.4%, a difference of 0.060%).
| Demographics | Rating | Rank | 3rd Grade |
| Immigrants | Nicaragua | 0.0 /100 | #320 | Tragic 96.5% |
| Indonesians | 0.0 /100 | #321 | Tragic 96.5% |
| Immigrants | Belize | 0.0 /100 | #322 | Tragic 96.5% |
| Hondurans | 0.0 /100 | #323 | Tragic 96.5% |
| Dominicans | 0.0 /100 | #324 | Tragic 96.4% |
| Mexican American Indians | 0.0 /100 | #325 | Tragic 96.4% |
| Immigrants | Vietnam | 0.0 /100 | #326 | Tragic 96.4% |
| Japanese | 0.0 /100 | #327 | Tragic 96.4% |
| Bangladeshis | 0.0 /100 | #328 | Tragic 96.3% |
| Immigrants | Honduras | 0.0 /100 | #329 | Tragic 96.3% |
| Immigrants | Armenia | 0.0 /100 | #330 | Tragic 96.3% |
| Immigrants | Latin America | 0.0 /100 | #331 | Tragic 96.2% |
| Mexicans | 0.0 /100 | #332 | Tragic 96.2% |
| Immigrants | Fiji | 0.0 /100 | #333 | Tragic 96.2% |
| Immigrants | Cambodia | 0.0 /100 | #334 | Tragic 96.2% |