Moroccan vs Immigrants from Cuba 9th Grade
COMPARE
Moroccan
Immigrants from Cuba
9th Grade
9th Grade Comparison
Moroccans
Immigrants from Cuba
94.6%
9TH GRADE
19.6/ 100
METRIC RATING
204th/ 347
METRIC RANK
92.2%
9TH GRADE
0.0/ 100
METRIC RATING
317th/ 347
METRIC RANK
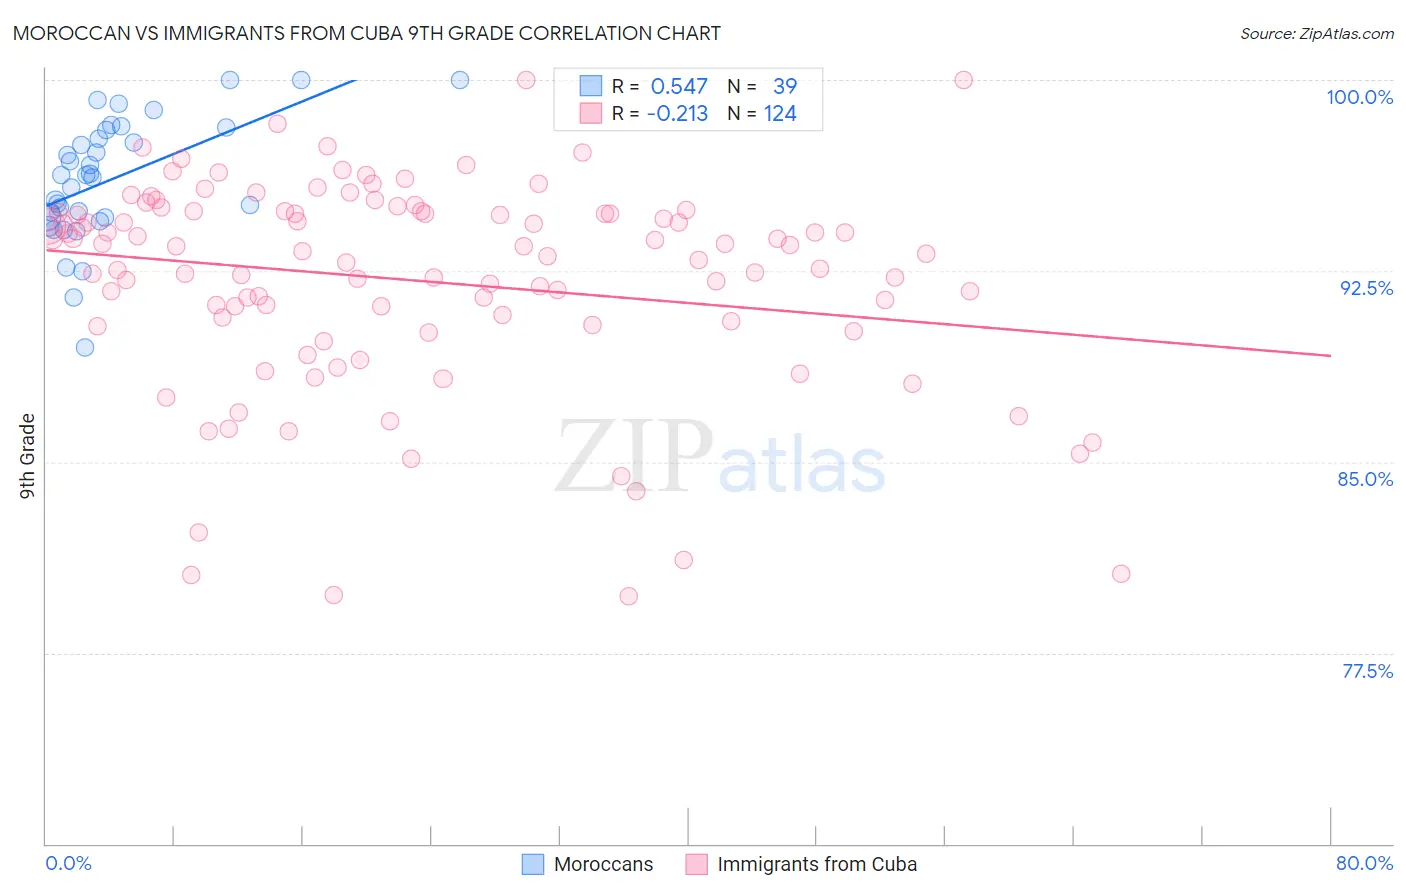
Moroccan vs Immigrants from Cuba 9th Grade Correlation Chart
The statistical analysis conducted on geographies consisting of 201,817,667 people shows a substantial positive correlation between the proportion of Moroccans and percentage of population with at least 9th grade education in the United States with a correlation coefficient (R) of 0.547 and weighted average of 94.6%. Similarly, the statistical analysis conducted on geographies consisting of 326,019,170 people shows a weak negative correlation between the proportion of Immigrants from Cuba and percentage of population with at least 9th grade education in the United States with a correlation coefficient (R) of -0.213 and weighted average of 92.2%, a difference of 2.6%.
9th Grade Correlation Summary
| Measurement | Moroccan | Immigrants from Cuba |
| Minimum | 89.5% | 79.7% |
| Maximum | 100.0% | 100.0% |
| Range | 10.5% | 20.3% |
| Mean | 96.1% | 92.1% |
| Median | 96.3% | 93.2% |
| Interquartile 25% (IQ1) | 94.6% | 90.5% |
| Interquartile 75% (IQ3) | 98.0% | 94.8% |
| Interquartile Range (IQR) | 3.4% | 4.4% |
| Standard Deviation (Sample) | 2.4% | 4.1% |
| Standard Deviation (Population) | 2.4% | 4.1% |
Similar Demographics by 9th Grade
Demographics Similar to Moroccans by 9th Grade
In terms of 9th grade, the demographic groups most similar to Moroccans are Immigrants from Eastern Asia (94.6%, a difference of 0.0%), Immigrants from Bahamas (94.6%, a difference of 0.0%), Immigrants from Zaire (94.6%, a difference of 0.010%), Black/African American (94.6%, a difference of 0.010%), and Laotian (94.6%, a difference of 0.020%).
| Demographics | Rating | Rank | 9th Grade |
| Immigrants | Micronesia | 24.7 /100 | #197 | Fair 94.7% |
| Hawaiians | 22.7 /100 | #198 | Fair 94.7% |
| Laotians | 21.0 /100 | #199 | Fair 94.6% |
| Immigrants | Zaire | 20.6 /100 | #200 | Fair 94.6% |
| Blacks/African Americans | 20.5 /100 | #201 | Fair 94.6% |
| Immigrants | Eastern Asia | 19.8 /100 | #202 | Poor 94.6% |
| Immigrants | Bahamas | 19.8 /100 | #203 | Poor 94.6% |
| Moroccans | 19.6 /100 | #204 | Poor 94.6% |
| Immigrants | Sudan | 17.6 /100 | #205 | Poor 94.6% |
| Samoans | 17.3 /100 | #206 | Poor 94.6% |
| Immigrants | Morocco | 16.3 /100 | #207 | Poor 94.6% |
| Immigrants | Pakistan | 15.5 /100 | #208 | Poor 94.6% |
| Comanche | 14.9 /100 | #209 | Poor 94.6% |
| Immigrants | Chile | 13.4 /100 | #210 | Poor 94.5% |
| Immigrants | Indonesia | 12.3 /100 | #211 | Poor 94.5% |
Demographics Similar to Immigrants from Cuba by 9th Grade
In terms of 9th grade, the demographic groups most similar to Immigrants from Cuba are Cape Verdean (92.2%, a difference of 0.010%), Immigrants from Caribbean (92.2%, a difference of 0.050%), Immigrants from Portugal (92.2%, a difference of 0.060%), Vietnamese (92.3%, a difference of 0.10%), and Houma (92.3%, a difference of 0.12%).
| Demographics | Rating | Rank | 9th Grade |
| Immigrants | Cambodia | 0.0 /100 | #310 | Tragic 92.4% |
| Immigrants | Fiji | 0.0 /100 | #311 | Tragic 92.3% |
| Houma | 0.0 /100 | #312 | Tragic 92.3% |
| Vietnamese | 0.0 /100 | #313 | Tragic 92.3% |
| Immigrants | Portugal | 0.0 /100 | #314 | Tragic 92.2% |
| Immigrants | Caribbean | 0.0 /100 | #315 | Tragic 92.2% |
| Cape Verdeans | 0.0 /100 | #316 | Tragic 92.2% |
| Immigrants | Cuba | 0.0 /100 | #317 | Tragic 92.2% |
| Nepalese | 0.0 /100 | #318 | Tragic 92.0% |
| Ecuadorians | 0.0 /100 | #319 | Tragic 91.9% |
| Nicaraguans | 0.0 /100 | #320 | Tragic 91.9% |
| Immigrants | Ecuador | 0.0 /100 | #321 | Tragic 91.8% |
| Belizeans | 0.0 /100 | #322 | Tragic 91.8% |
| Puerto Ricans | 0.0 /100 | #323 | Tragic 91.8% |
| Immigrants | Belize | 0.0 /100 | #324 | Tragic 91.8% |