Moroccan vs Taiwanese 7th Grade
COMPARE
Moroccan
Taiwanese
7th Grade
7th Grade Comparison
Moroccans
Taiwanese
95.8%
7TH GRADE
18.9/ 100
METRIC RATING
205th/ 347
METRIC RANK
94.8%
7TH GRADE
0.0/ 100
METRIC RATING
289th/ 347
METRIC RANK
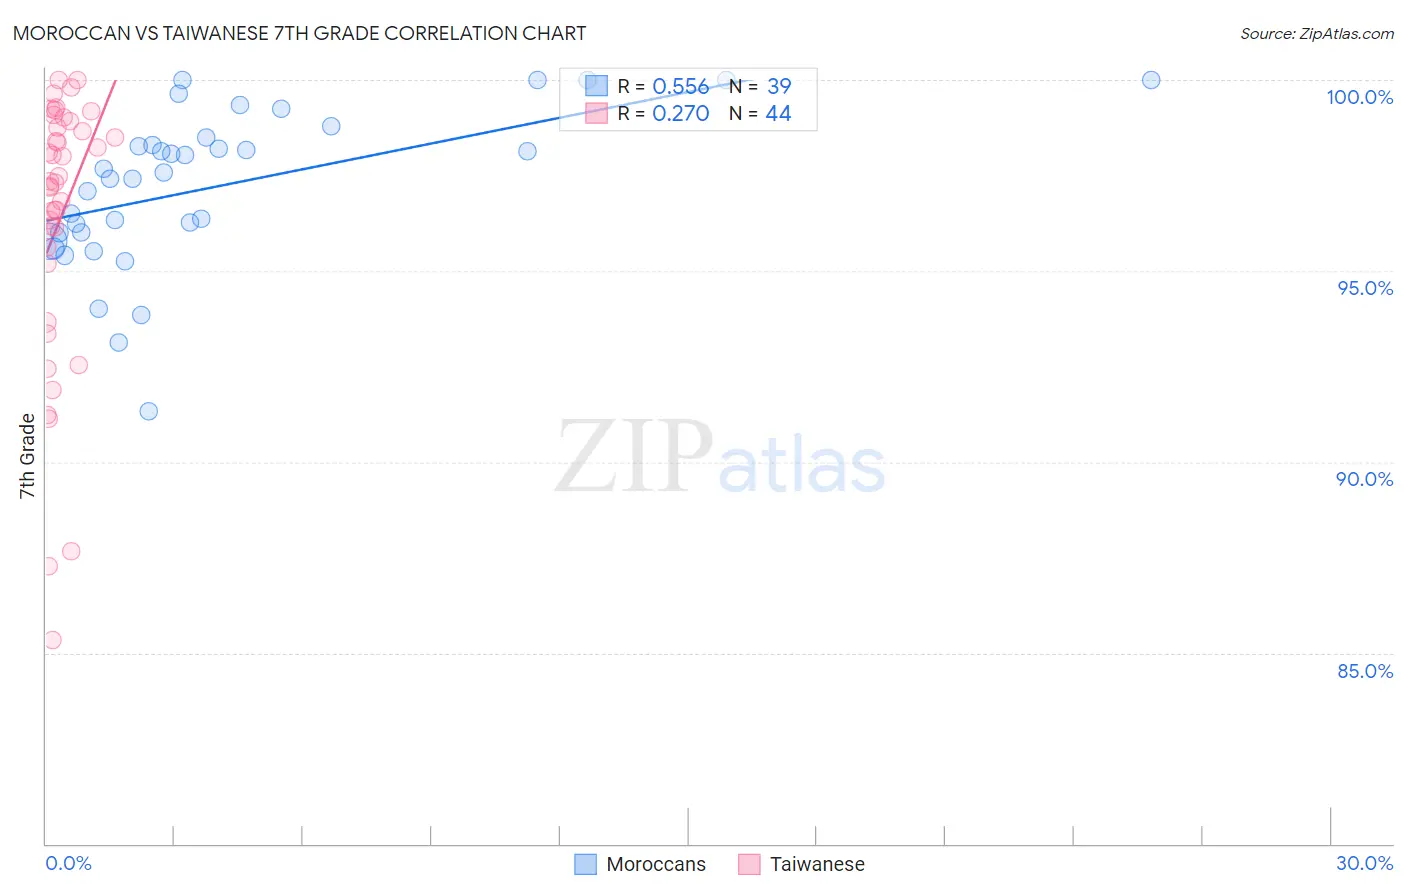
Moroccan vs Taiwanese 7th Grade Correlation Chart
The statistical analysis conducted on geographies consisting of 201,817,667 people shows a substantial positive correlation between the proportion of Moroccans and percentage of population with at least 7th grade education in the United States with a correlation coefficient (R) of 0.556 and weighted average of 95.8%. Similarly, the statistical analysis conducted on geographies consisting of 31,724,936 people shows a weak positive correlation between the proportion of Taiwanese and percentage of population with at least 7th grade education in the United States with a correlation coefficient (R) of 0.270 and weighted average of 94.8%, a difference of 1.0%.
7th Grade Correlation Summary
| Measurement | Moroccan | Taiwanese |
| Minimum | 91.3% | 85.3% |
| Maximum | 100.0% | 100.0% |
| Range | 8.7% | 14.7% |
| Mean | 97.2% | 96.3% |
| Median | 97.6% | 97.3% |
| Interquartile 25% (IQ1) | 96.0% | 95.4% |
| Interquartile 75% (IQ3) | 98.5% | 98.8% |
| Interquartile Range (IQR) | 2.5% | 3.4% |
| Standard Deviation (Sample) | 2.0% | 3.6% |
| Standard Deviation (Population) | 2.0% | 3.5% |
Similar Demographics by 7th Grade
Demographics Similar to Moroccans by 7th Grade
In terms of 7th grade, the demographic groups most similar to Moroccans are African (95.8%, a difference of 0.010%), Immigrants from Northern Africa (95.8%, a difference of 0.020%), Comanche (95.8%, a difference of 0.020%), Assyrian/Chaldean/Syriac (95.8%, a difference of 0.020%), and Navajo (95.8%, a difference of 0.020%).
| Demographics | Rating | Rank | 7th Grade |
| Paraguayans | 24.8 /100 | #198 | Fair 95.9% |
| Guamanians/Chamorros | 23.5 /100 | #199 | Fair 95.9% |
| Argentineans | 23.2 /100 | #200 | Fair 95.9% |
| Immigrants | Argentina | 21.9 /100 | #201 | Fair 95.9% |
| Immigrants | Northern Africa | 21.4 /100 | #202 | Fair 95.8% |
| Comanche | 21.1 /100 | #203 | Fair 95.8% |
| Assyrians/Chaldeans/Syriacs | 20.5 /100 | #204 | Fair 95.8% |
| Moroccans | 18.9 /100 | #205 | Poor 95.8% |
| Africans | 17.6 /100 | #206 | Poor 95.8% |
| Navajo | 17.0 /100 | #207 | Poor 95.8% |
| Immigrants | Sudan | 17.0 /100 | #208 | Poor 95.8% |
| Dutch West Indians | 16.1 /100 | #209 | Poor 95.8% |
| Hawaiians | 16.0 /100 | #210 | Poor 95.8% |
| Portuguese | 13.6 /100 | #211 | Poor 95.8% |
| Immigrants | Lebanon | 13.0 /100 | #212 | Poor 95.8% |
Demographics Similar to Taiwanese by 7th Grade
In terms of 7th grade, the demographic groups most similar to Taiwanese are British West Indian (94.8%, a difference of 0.010%), Malaysian (94.8%, a difference of 0.020%), Immigrants from Peru (94.9%, a difference of 0.030%), Immigrants from Philippines (94.9%, a difference of 0.040%), and Immigrants from Grenada (94.8%, a difference of 0.060%).
| Demographics | Rating | Rank | 7th Grade |
| Immigrants | Bolivia | 0.1 /100 | #282 | Tragic 95.0% |
| Immigrants | Barbados | 0.1 /100 | #283 | Tragic 95.0% |
| Armenians | 0.1 /100 | #284 | Tragic 95.0% |
| Immigrants | Eritrea | 0.1 /100 | #285 | Tragic 94.9% |
| Immigrants | Philippines | 0.0 /100 | #286 | Tragic 94.9% |
| Immigrants | Peru | 0.0 /100 | #287 | Tragic 94.9% |
| British West Indians | 0.0 /100 | #288 | Tragic 94.8% |
| Taiwanese | 0.0 /100 | #289 | Tragic 94.8% |
| Malaysians | 0.0 /100 | #290 | Tragic 94.8% |
| Immigrants | Grenada | 0.0 /100 | #291 | Tragic 94.8% |
| Immigrants | West Indies | 0.0 /100 | #292 | Tragic 94.8% |
| Fijians | 0.0 /100 | #293 | Tragic 94.7% |
| Haitians | 0.0 /100 | #294 | Tragic 94.7% |
| Yaqui | 0.0 /100 | #295 | Tragic 94.6% |
| Cubans | 0.0 /100 | #296 | Tragic 94.6% |