Immigrants from Belgium vs Immigrants from Cuba 9th Grade
COMPARE
Immigrants from Belgium
Immigrants from Cuba
9th Grade
9th Grade Comparison
Immigrants from Belgium
Immigrants from Cuba
95.8%
9TH GRADE
99.5/ 100
METRIC RATING
71st/ 347
METRIC RANK
92.2%
9TH GRADE
0.0/ 100
METRIC RATING
317th/ 347
METRIC RANK
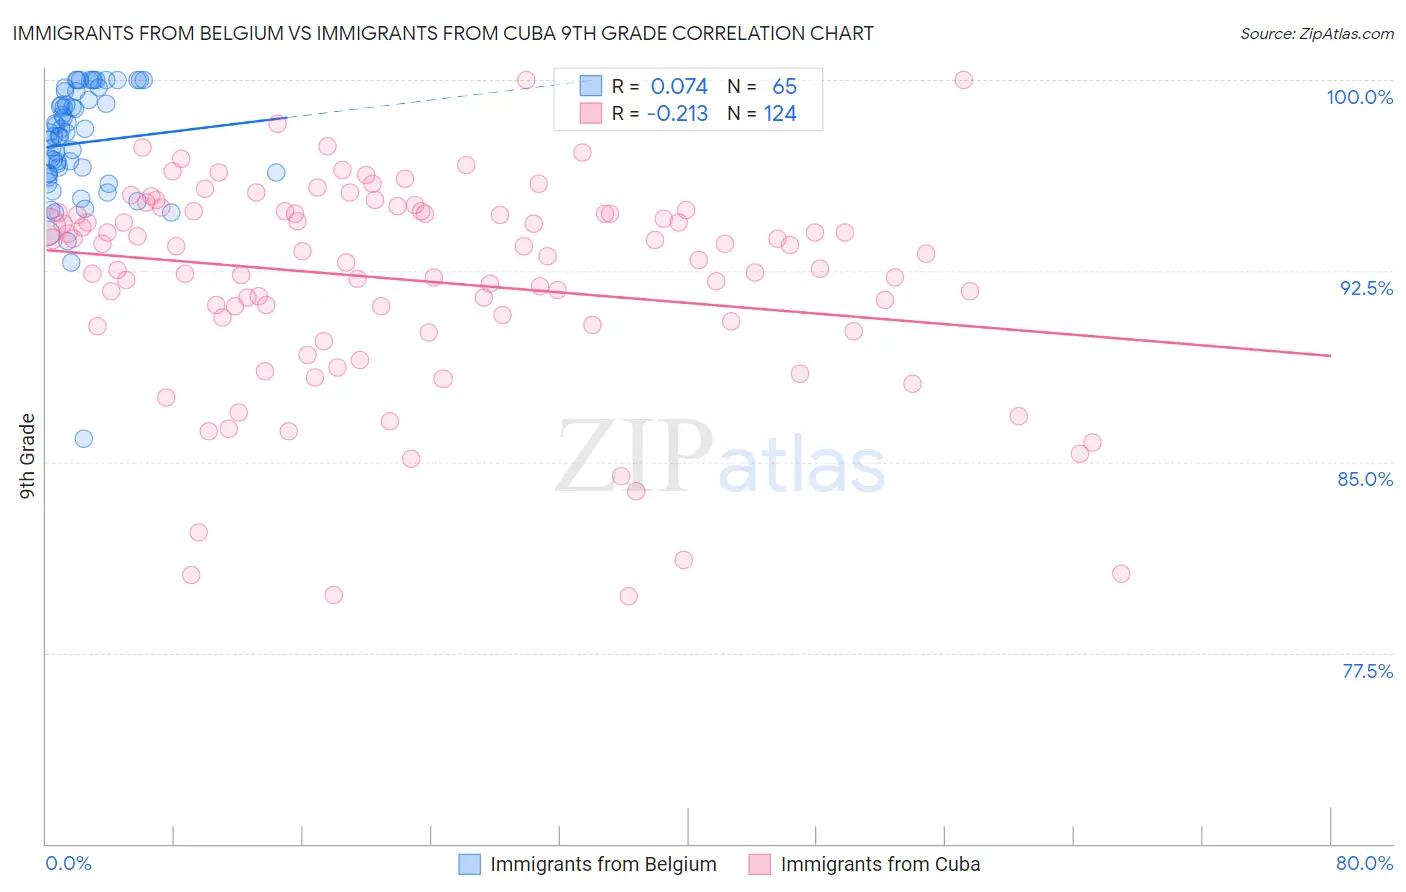
Immigrants from Belgium vs Immigrants from Cuba 9th Grade Correlation Chart
The statistical analysis conducted on geographies consisting of 146,727,969 people shows a slight positive correlation between the proportion of Immigrants from Belgium and percentage of population with at least 9th grade education in the United States with a correlation coefficient (R) of 0.074 and weighted average of 95.8%. Similarly, the statistical analysis conducted on geographies consisting of 326,019,170 people shows a weak negative correlation between the proportion of Immigrants from Cuba and percentage of population with at least 9th grade education in the United States with a correlation coefficient (R) of -0.213 and weighted average of 92.2%, a difference of 3.9%.
9th Grade Correlation Summary
| Measurement | Immigrants from Belgium | Immigrants from Cuba |
| Minimum | 85.9% | 79.7% |
| Maximum | 100.0% | 100.0% |
| Range | 14.1% | 20.3% |
| Mean | 97.5% | 92.1% |
| Median | 97.9% | 93.2% |
| Interquartile 25% (IQ1) | 96.3% | 90.5% |
| Interquartile 75% (IQ3) | 99.4% | 94.8% |
| Interquartile Range (IQR) | 3.0% | 4.4% |
| Standard Deviation (Sample) | 2.4% | 4.1% |
| Standard Deviation (Population) | 2.4% | 4.1% |
Similar Demographics by 9th Grade
Demographics Similar to Immigrants from Belgium by 9th Grade
In terms of 9th grade, the demographic groups most similar to Immigrants from Belgium are Turkish (95.8%, a difference of 0.0%), Immigrants from Singapore (95.8%, a difference of 0.0%), Immigrants from Australia (95.8%, a difference of 0.010%), Thai (95.8%, a difference of 0.010%), and Immigrants from Ireland (95.8%, a difference of 0.020%).
| Demographics | Rating | Rank | 9th Grade |
| Zimbabweans | 99.7 /100 | #64 | Exceptional 95.9% |
| Immigrants | England | 99.6 /100 | #65 | Exceptional 95.9% |
| Immigrants | Netherlands | 99.6 /100 | #66 | Exceptional 95.8% |
| Cypriots | 99.6 /100 | #67 | Exceptional 95.8% |
| Immigrants | Ireland | 99.6 /100 | #68 | Exceptional 95.8% |
| Immigrants | Lithuania | 99.6 /100 | #69 | Exceptional 95.8% |
| Immigrants | Australia | 99.5 /100 | #70 | Exceptional 95.8% |
| Immigrants | Belgium | 99.5 /100 | #71 | Exceptional 95.8% |
| Turks | 99.5 /100 | #72 | Exceptional 95.8% |
| Immigrants | Singapore | 99.5 /100 | #73 | Exceptional 95.8% |
| Thais | 99.5 /100 | #74 | Exceptional 95.8% |
| Inupiat | 99.5 /100 | #75 | Exceptional 95.8% |
| Immigrants | Sweden | 99.5 /100 | #76 | Exceptional 95.8% |
| Whites/Caucasians | 99.4 /100 | #77 | Exceptional 95.8% |
| Immigrants | South Africa | 99.4 /100 | #78 | Exceptional 95.8% |
Demographics Similar to Immigrants from Cuba by 9th Grade
In terms of 9th grade, the demographic groups most similar to Immigrants from Cuba are Cape Verdean (92.2%, a difference of 0.010%), Immigrants from Caribbean (92.2%, a difference of 0.050%), Immigrants from Portugal (92.2%, a difference of 0.060%), Vietnamese (92.3%, a difference of 0.10%), and Houma (92.3%, a difference of 0.12%).
| Demographics | Rating | Rank | 9th Grade |
| Immigrants | Cambodia | 0.0 /100 | #310 | Tragic 92.4% |
| Immigrants | Fiji | 0.0 /100 | #311 | Tragic 92.3% |
| Houma | 0.0 /100 | #312 | Tragic 92.3% |
| Vietnamese | 0.0 /100 | #313 | Tragic 92.3% |
| Immigrants | Portugal | 0.0 /100 | #314 | Tragic 92.2% |
| Immigrants | Caribbean | 0.0 /100 | #315 | Tragic 92.2% |
| Cape Verdeans | 0.0 /100 | #316 | Tragic 92.2% |
| Immigrants | Cuba | 0.0 /100 | #317 | Tragic 92.2% |
| Nepalese | 0.0 /100 | #318 | Tragic 92.0% |
| Ecuadorians | 0.0 /100 | #319 | Tragic 91.9% |
| Nicaraguans | 0.0 /100 | #320 | Tragic 91.9% |
| Immigrants | Ecuador | 0.0 /100 | #321 | Tragic 91.8% |
| Belizeans | 0.0 /100 | #322 | Tragic 91.8% |
| Puerto Ricans | 0.0 /100 | #323 | Tragic 91.8% |
| Immigrants | Belize | 0.0 /100 | #324 | Tragic 91.8% |