Immigrants from Oceania vs Sudanese Associate's Degree
COMPARE
Immigrants from Oceania
Sudanese
Associate's Degree
Associate's Degree Comparison
Immigrants from Oceania
Sudanese
45.8%
ASSOCIATE'S DEGREE
34.7/ 100
METRIC RATING
189th/ 347
METRIC RANK
47.1%
ASSOCIATE'S DEGREE
70.3/ 100
METRIC RATING
157th/ 347
METRIC RANK
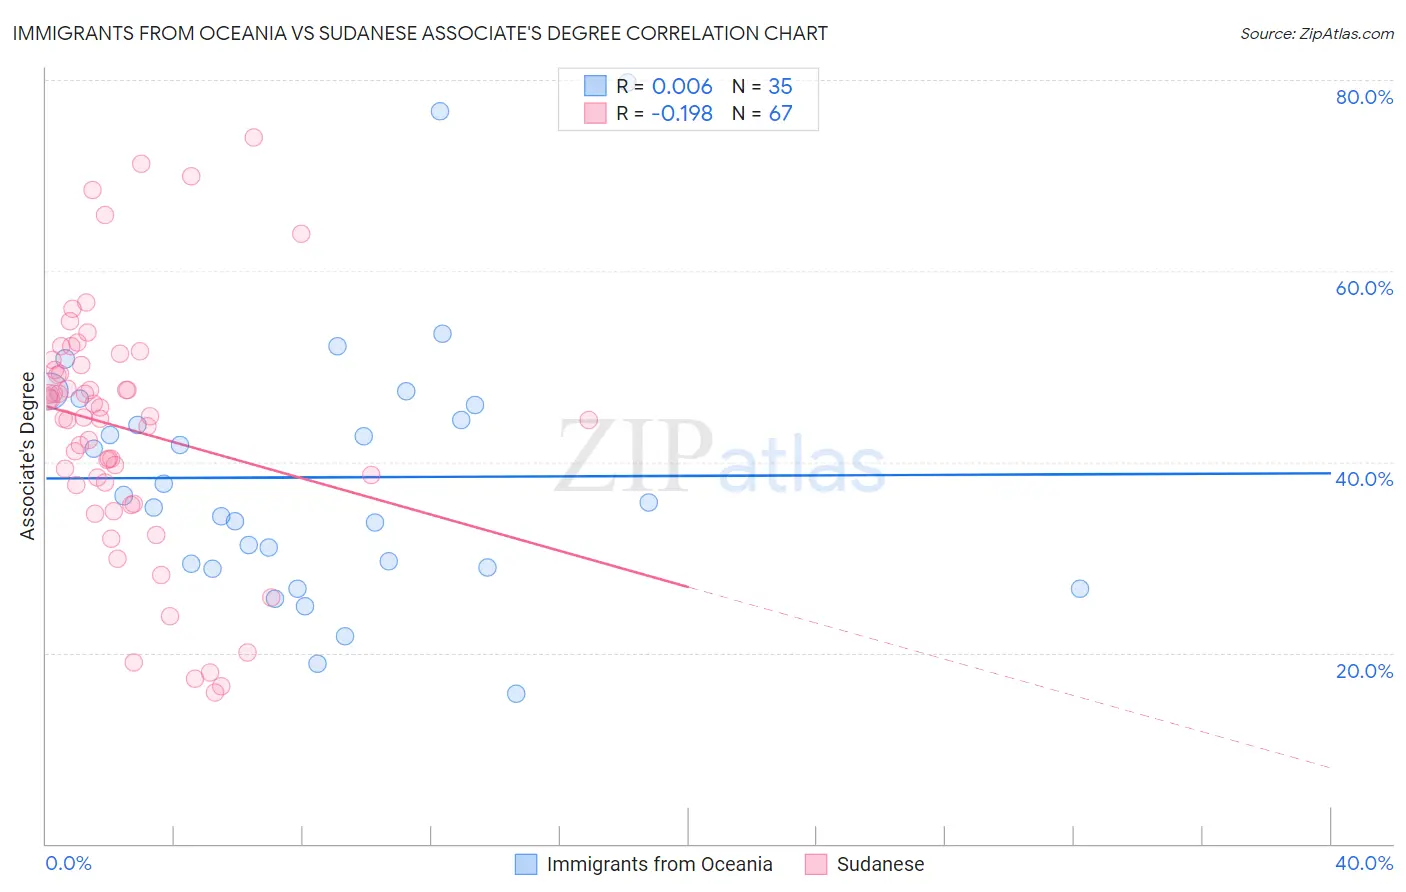
Immigrants from Oceania vs Sudanese Associate's Degree Correlation Chart
The statistical analysis conducted on geographies consisting of 305,516,094 people shows no correlation between the proportion of Immigrants from Oceania and percentage of population with at least associate's degree education in the United States with a correlation coefficient (R) of 0.006 and weighted average of 45.8%. Similarly, the statistical analysis conducted on geographies consisting of 110,144,981 people shows a poor negative correlation between the proportion of Sudanese and percentage of population with at least associate's degree education in the United States with a correlation coefficient (R) of -0.198 and weighted average of 47.1%, a difference of 2.8%.
Associate's Degree Correlation Summary
| Measurement | Immigrants from Oceania | Sudanese |
| Minimum | 15.7% | 15.8% |
| Maximum | 79.8% | 74.0% |
| Range | 64.1% | 58.2% |
| Mean | 38.4% | 43.5% |
| Median | 35.7% | 44.6% |
| Interquartile 25% (IQ1) | 28.9% | 37.6% |
| Interquartile 75% (IQ3) | 46.0% | 50.2% |
| Interquartile Range (IQR) | 17.0% | 12.6% |
| Standard Deviation (Sample) | 13.8% | 12.9% |
| Standard Deviation (Population) | 13.6% | 12.8% |
Similar Demographics by Associate's Degree
Demographics Similar to Immigrants from Oceania by Associate's Degree
In terms of associate's degree, the demographic groups most similar to Immigrants from Oceania are Immigrants from Uruguay (45.8%, a difference of 0.060%), Ghanaian (45.8%, a difference of 0.060%), Vietnamese (45.8%, a difference of 0.060%), Korean (45.8%, a difference of 0.070%), and Celtic (45.8%, a difference of 0.12%).
| Demographics | Rating | Rank | Associate's Degree |
| Swiss | 40.4 /100 | #182 | Average 46.0% |
| Yugoslavians | 40.2 /100 | #183 | Average 46.0% |
| Czechoslovakians | 40.0 /100 | #184 | Average 46.0% |
| Costa Ricans | 38.6 /100 | #185 | Fair 46.0% |
| Welsh | 37.9 /100 | #186 | Fair 45.9% |
| Immigrants | Uruguay | 35.5 /100 | #187 | Fair 45.8% |
| Ghanaians | 35.5 /100 | #188 | Fair 45.8% |
| Immigrants | Oceania | 34.7 /100 | #189 | Fair 45.8% |
| Vietnamese | 34.0 /100 | #190 | Fair 45.8% |
| Koreans | 33.8 /100 | #191 | Fair 45.8% |
| Celtics | 33.3 /100 | #192 | Fair 45.8% |
| Immigrants | Cameroon | 31.0 /100 | #193 | Fair 45.7% |
| Immigrants | Peru | 27.6 /100 | #194 | Fair 45.5% |
| Germans | 26.5 /100 | #195 | Fair 45.5% |
| French | 25.6 /100 | #196 | Fair 45.4% |
Demographics Similar to Sudanese by Associate's Degree
In terms of associate's degree, the demographic groups most similar to Sudanese are South American (47.1%, a difference of 0.020%), Kenyan (47.1%, a difference of 0.030%), Immigrants from Germany (47.1%, a difference of 0.040%), Immigrants from Poland (47.1%, a difference of 0.090%), and Immigrants from Kenya (47.2%, a difference of 0.16%).
| Demographics | Rating | Rank | Associate's Degree |
| Iraqis | 76.2 /100 | #150 | Good 47.4% |
| Immigrants | North Macedonia | 76.0 /100 | #151 | Good 47.4% |
| Immigrants | Afghanistan | 74.3 /100 | #152 | Good 47.3% |
| Czechs | 72.2 /100 | #153 | Good 47.2% |
| Immigrants | Kenya | 72.1 /100 | #154 | Good 47.2% |
| Kenyans | 70.6 /100 | #155 | Good 47.1% |
| South Americans | 70.5 /100 | #156 | Good 47.1% |
| Sudanese | 70.3 /100 | #157 | Good 47.1% |
| Immigrants | Germany | 69.7 /100 | #158 | Good 47.1% |
| Immigrants | Poland | 69.2 /100 | #159 | Good 47.1% |
| Scottish | 65.4 /100 | #160 | Good 46.9% |
| Scandinavians | 65.2 /100 | #161 | Good 46.9% |
| Immigrants | Africa | 63.2 /100 | #162 | Good 46.8% |
| Somalis | 62.5 /100 | #163 | Good 46.8% |
| Colombians | 62.4 /100 | #164 | Good 46.8% |