Immigrants from Argentina vs Serbian 10th Grade
COMPARE
Immigrants from Argentina
Serbian
10th Grade
10th Grade Comparison
Immigrants from Argentina
Serbians
93.7%
10TH GRADE
47.1/ 100
METRIC RATING
176th/ 347
METRIC RANK
95.1%
10TH GRADE
99.9/ 100
METRIC RATING
47th/ 347
METRIC RANK
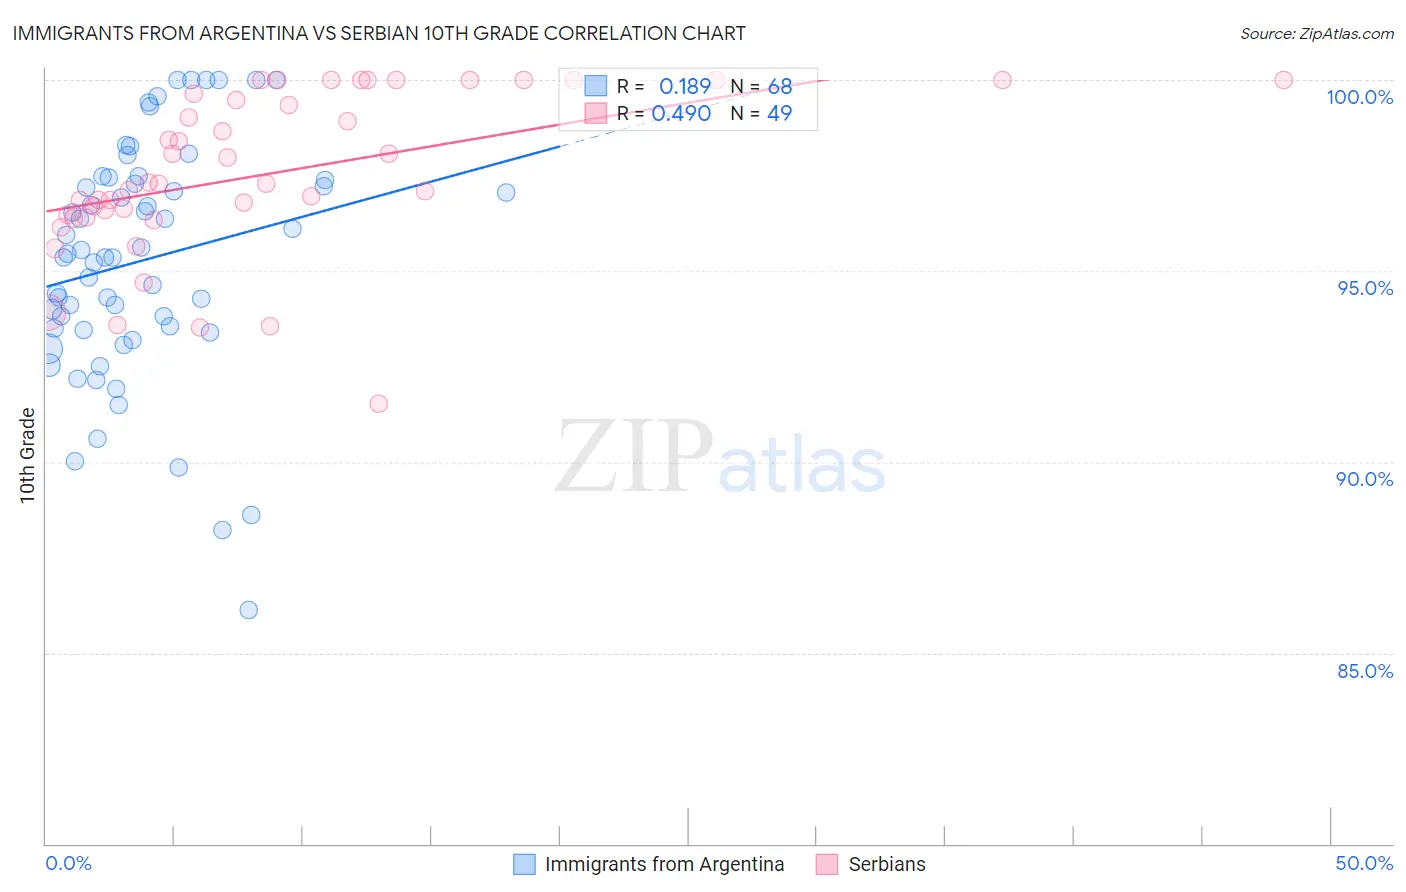
Immigrants from Argentina vs Serbian 10th Grade Correlation Chart
The statistical analysis conducted on geographies consisting of 264,436,618 people shows a poor positive correlation between the proportion of Immigrants from Argentina and percentage of population with at least 10th grade education in the United States with a correlation coefficient (R) of 0.189 and weighted average of 93.7%. Similarly, the statistical analysis conducted on geographies consisting of 267,640,774 people shows a moderate positive correlation between the proportion of Serbians and percentage of population with at least 10th grade education in the United States with a correlation coefficient (R) of 0.490 and weighted average of 95.1%, a difference of 1.5%.
10th Grade Correlation Summary
| Measurement | Immigrants from Argentina | Serbian |
| Minimum | 86.1% | 91.5% |
| Maximum | 100.0% | 100.0% |
| Range | 13.9% | 8.5% |
| Mean | 95.3% | 97.6% |
| Median | 95.4% | 97.3% |
| Interquartile 25% (IQ1) | 93.5% | 96.4% |
| Interquartile 75% (IQ3) | 97.3% | 99.8% |
| Interquartile Range (IQR) | 3.9% | 3.4% |
| Standard Deviation (Sample) | 3.1% | 2.1% |
| Standard Deviation (Population) | 3.0% | 2.1% |
Similar Demographics by 10th Grade
Demographics Similar to Immigrants from Argentina by 10th Grade
In terms of 10th grade, the demographic groups most similar to Immigrants from Argentina are Immigrants from Lebanon (93.7%, a difference of 0.0%), Sierra Leonean (93.7%, a difference of 0.010%), Immigrants from Nepal (93.7%, a difference of 0.020%), Paraguayan (93.7%, a difference of 0.020%), and French American Indian (93.7%, a difference of 0.030%).
| Demographics | Rating | Rank | 10th Grade |
| Immigrants | Spain | 55.9 /100 | #169 | Average 93.8% |
| Immigrants | Venezuela | 53.9 /100 | #170 | Average 93.8% |
| Immigrants | Albania | 52.4 /100 | #171 | Average 93.8% |
| French American Indians | 50.9 /100 | #172 | Average 93.7% |
| Spaniards | 50.3 /100 | #173 | Average 93.7% |
| Argentineans | 50.0 /100 | #174 | Average 93.7% |
| Immigrants | Nepal | 49.6 /100 | #175 | Average 93.7% |
| Immigrants | Argentina | 47.1 /100 | #176 | Average 93.7% |
| Immigrants | Lebanon | 47.1 /100 | #177 | Average 93.7% |
| Sierra Leoneans | 46.1 /100 | #178 | Average 93.7% |
| Paraguayans | 45.3 /100 | #179 | Average 93.7% |
| Blackfeet | 42.8 /100 | #180 | Average 93.7% |
| Immigrants | Northern Africa | 41.6 /100 | #181 | Average 93.7% |
| Colville | 38.8 /100 | #182 | Fair 93.6% |
| Guamanians/Chamorros | 37.1 /100 | #183 | Fair 93.6% |
Demographics Similar to Serbians by 10th Grade
In terms of 10th grade, the demographic groups most similar to Serbians are Czechoslovakian (95.1%, a difference of 0.010%), Immigrants from Northern Europe (95.2%, a difference of 0.020%), Greek (95.2%, a difference of 0.020%), Australian (95.1%, a difference of 0.020%), and Macedonian (95.2%, a difference of 0.030%).
| Demographics | Rating | Rank | 10th Grade |
| Scotch-Irish | 99.9 /100 | #40 | Exceptional 95.2% |
| Russians | 99.9 /100 | #41 | Exceptional 95.2% |
| Slavs | 99.9 /100 | #42 | Exceptional 95.2% |
| Macedonians | 99.9 /100 | #43 | Exceptional 95.2% |
| Immigrants | Northern Europe | 99.9 /100 | #44 | Exceptional 95.2% |
| Greeks | 99.9 /100 | #45 | Exceptional 95.2% |
| Czechoslovakians | 99.9 /100 | #46 | Exceptional 95.1% |
| Serbians | 99.9 /100 | #47 | Exceptional 95.1% |
| Australians | 99.9 /100 | #48 | Exceptional 95.1% |
| Immigrants | Austria | 99.9 /100 | #49 | Exceptional 95.1% |
| Immigrants | Canada | 99.8 /100 | #50 | Exceptional 95.1% |
| Austrians | 99.8 /100 | #51 | Exceptional 95.1% |
| Ottawa | 99.8 /100 | #52 | Exceptional 95.1% |
| Immigrants | North America | 99.8 /100 | #53 | Exceptional 95.0% |
| Immigrants | Lithuania | 99.8 /100 | #54 | Exceptional 95.0% |